
Sep 25, 2024

Casey Bjorkdahl is one of the pioneering thought leaders in the SEO community. In 2010, Casey co-founded Vazoola after working for a Digital Marketing Agency for five years in New York City. Vazoola is now one of the fastest growing and most widely recognized SEO marketing firms in the country.
Do infographics still work for SEO?
It's true that visual content reigns supreme in the world of digital marketing.
Among search engine optimization strategies that boost online visibility, infographics stand out as particularly effective.
The infographics SEO approach involves compelling, informative, and creative graphics. These graphics are visually appealing and rich in valuable information.
Informational infographics then are used to generate backlinks to a website. That significantly boosts its SEO performance.
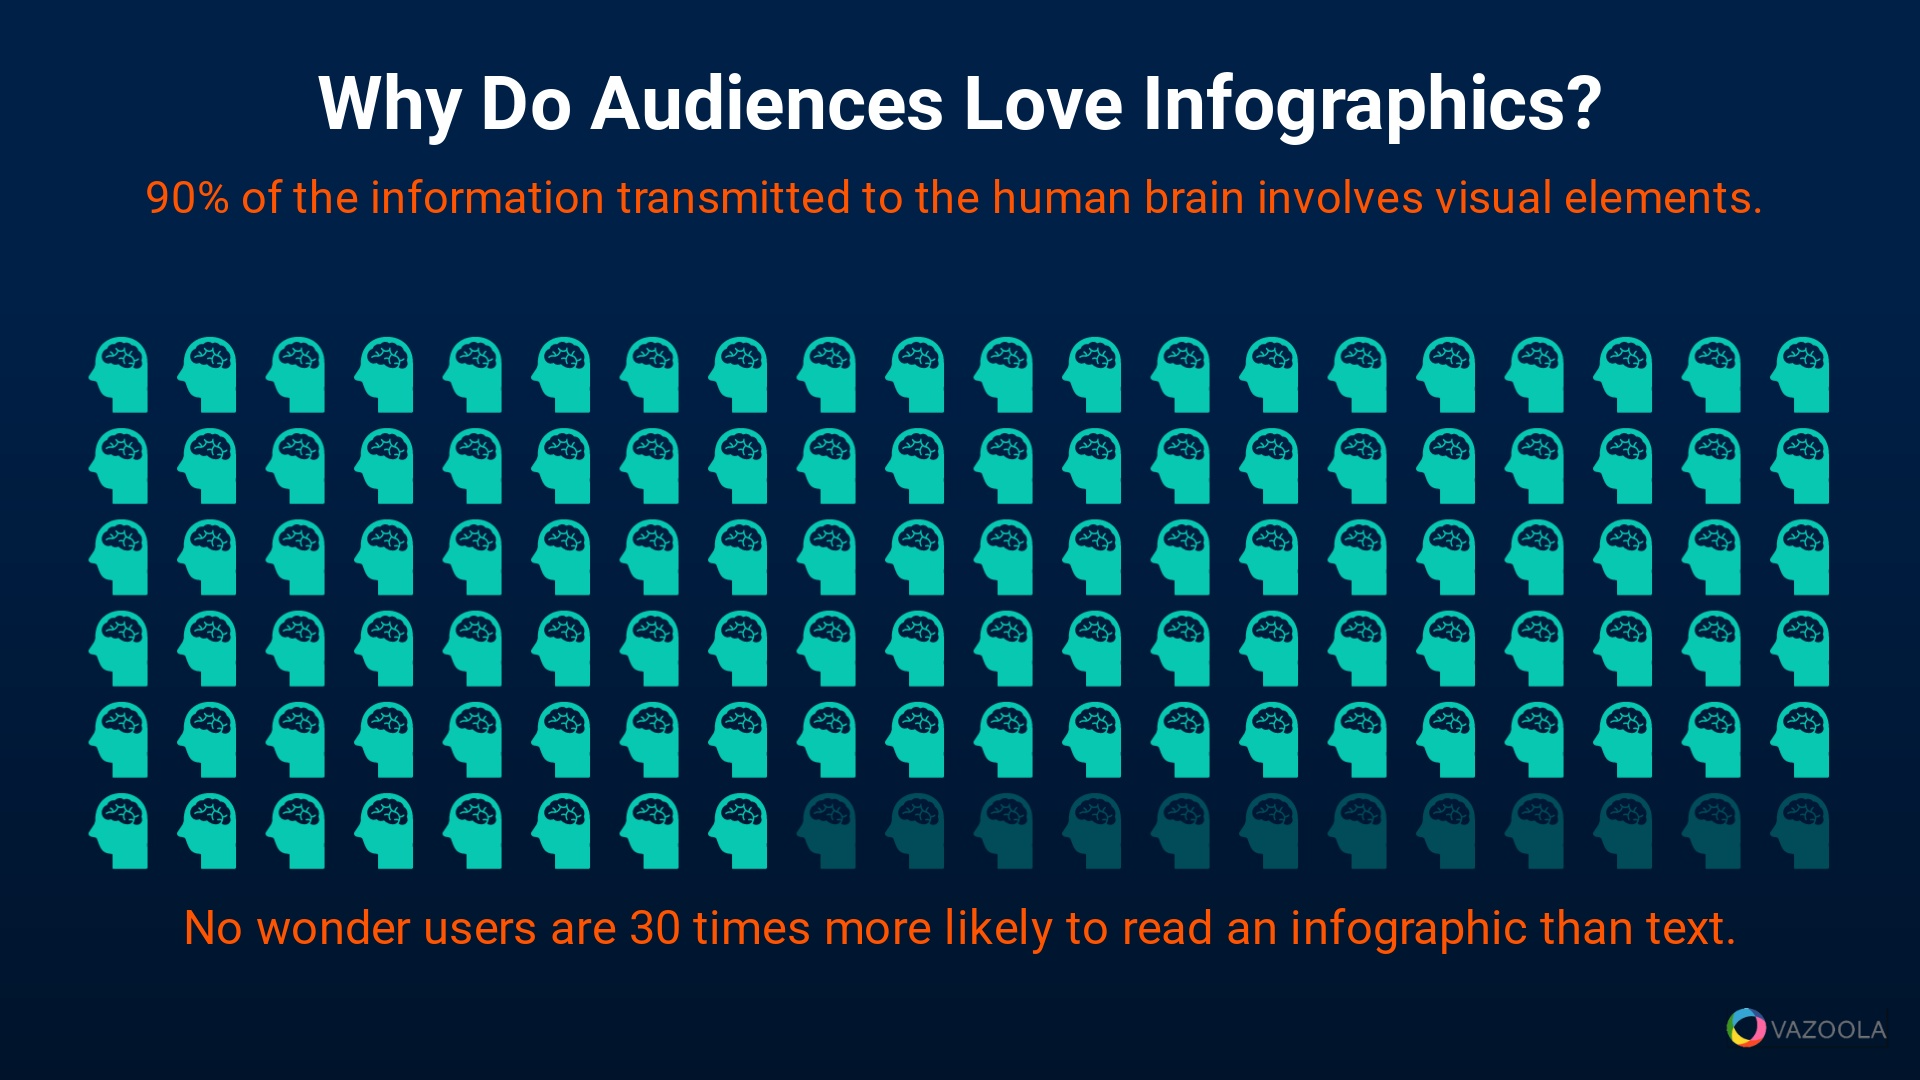
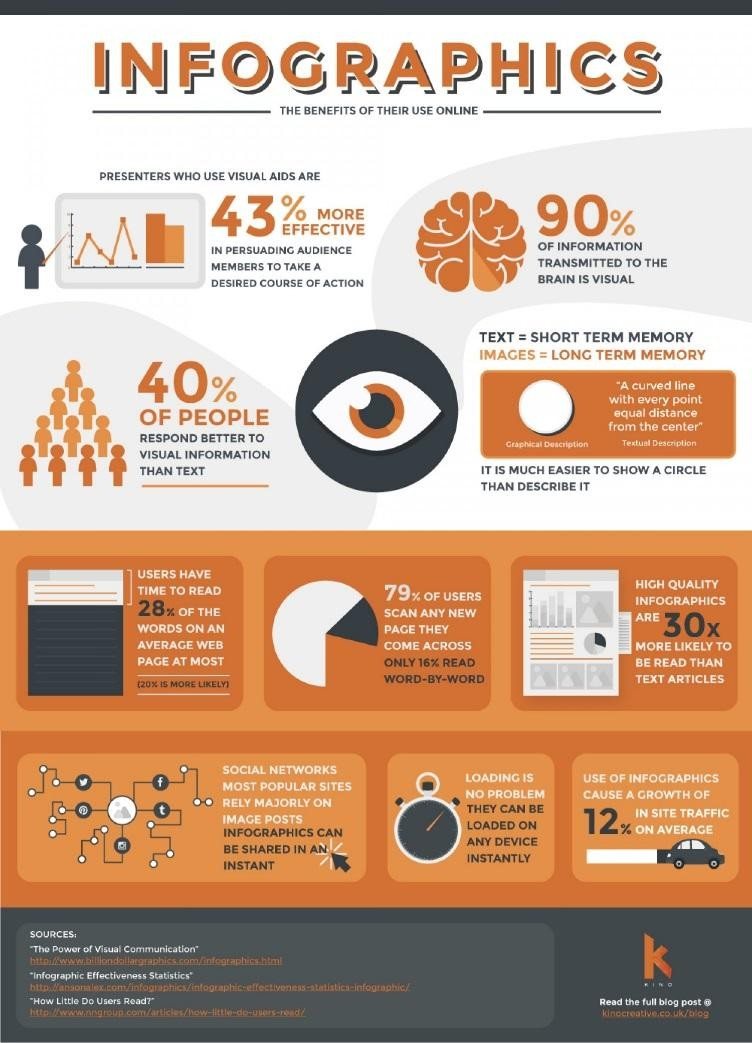
Why are infographics such an effective strategy for SEO? For starters, 90% of the information transmitted to our brains is visual.
It's no wonder why infographics are30 times more likely to be read than text articles, according to Visual.ly CEO Stew Langille.
Key Takeaways:
-
When you use infographics for SEO, you enjoy benefits including increased engagement, enhanced share-ability, improved SEO performance, and effective brand promotion.
-
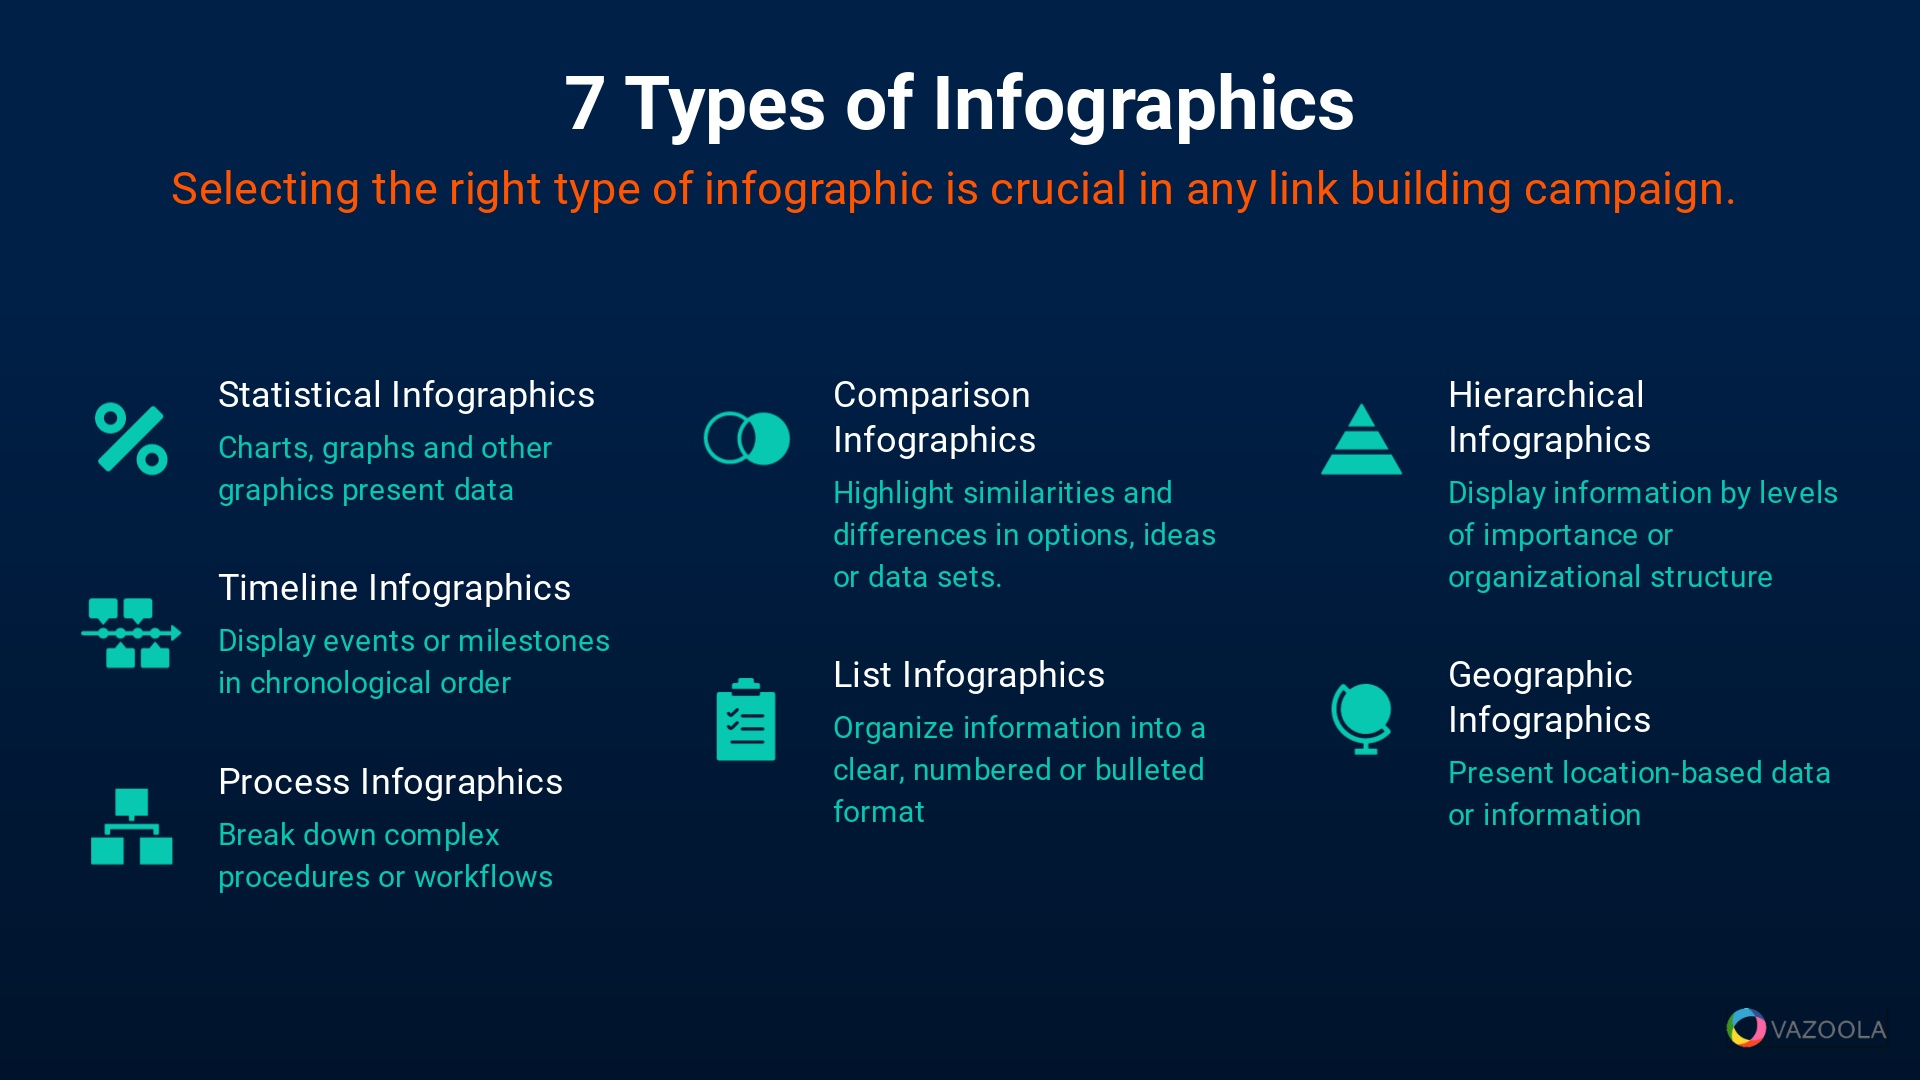
Different types of infographics, such as statistical, timeline, process, comparison, list, hierarchical, and geographic, cater to different informational needs and preferences.
-
An effective infographic is characterized by a clear message, visually appealing design, accurate data, easy understandability, audience relevance, brand alignment, and share-ability.
-
Building an impactful infographic requires determining objectives, identifying the target audience, choosing a topic, conducting thorough research, developing a narrative, creating a framework, and designing the infographic.
-
To build links with infographics, publish the infographic, promote it on social media, conduct outreach, send to infographic directories, and submit a press release.
Table of Contents:
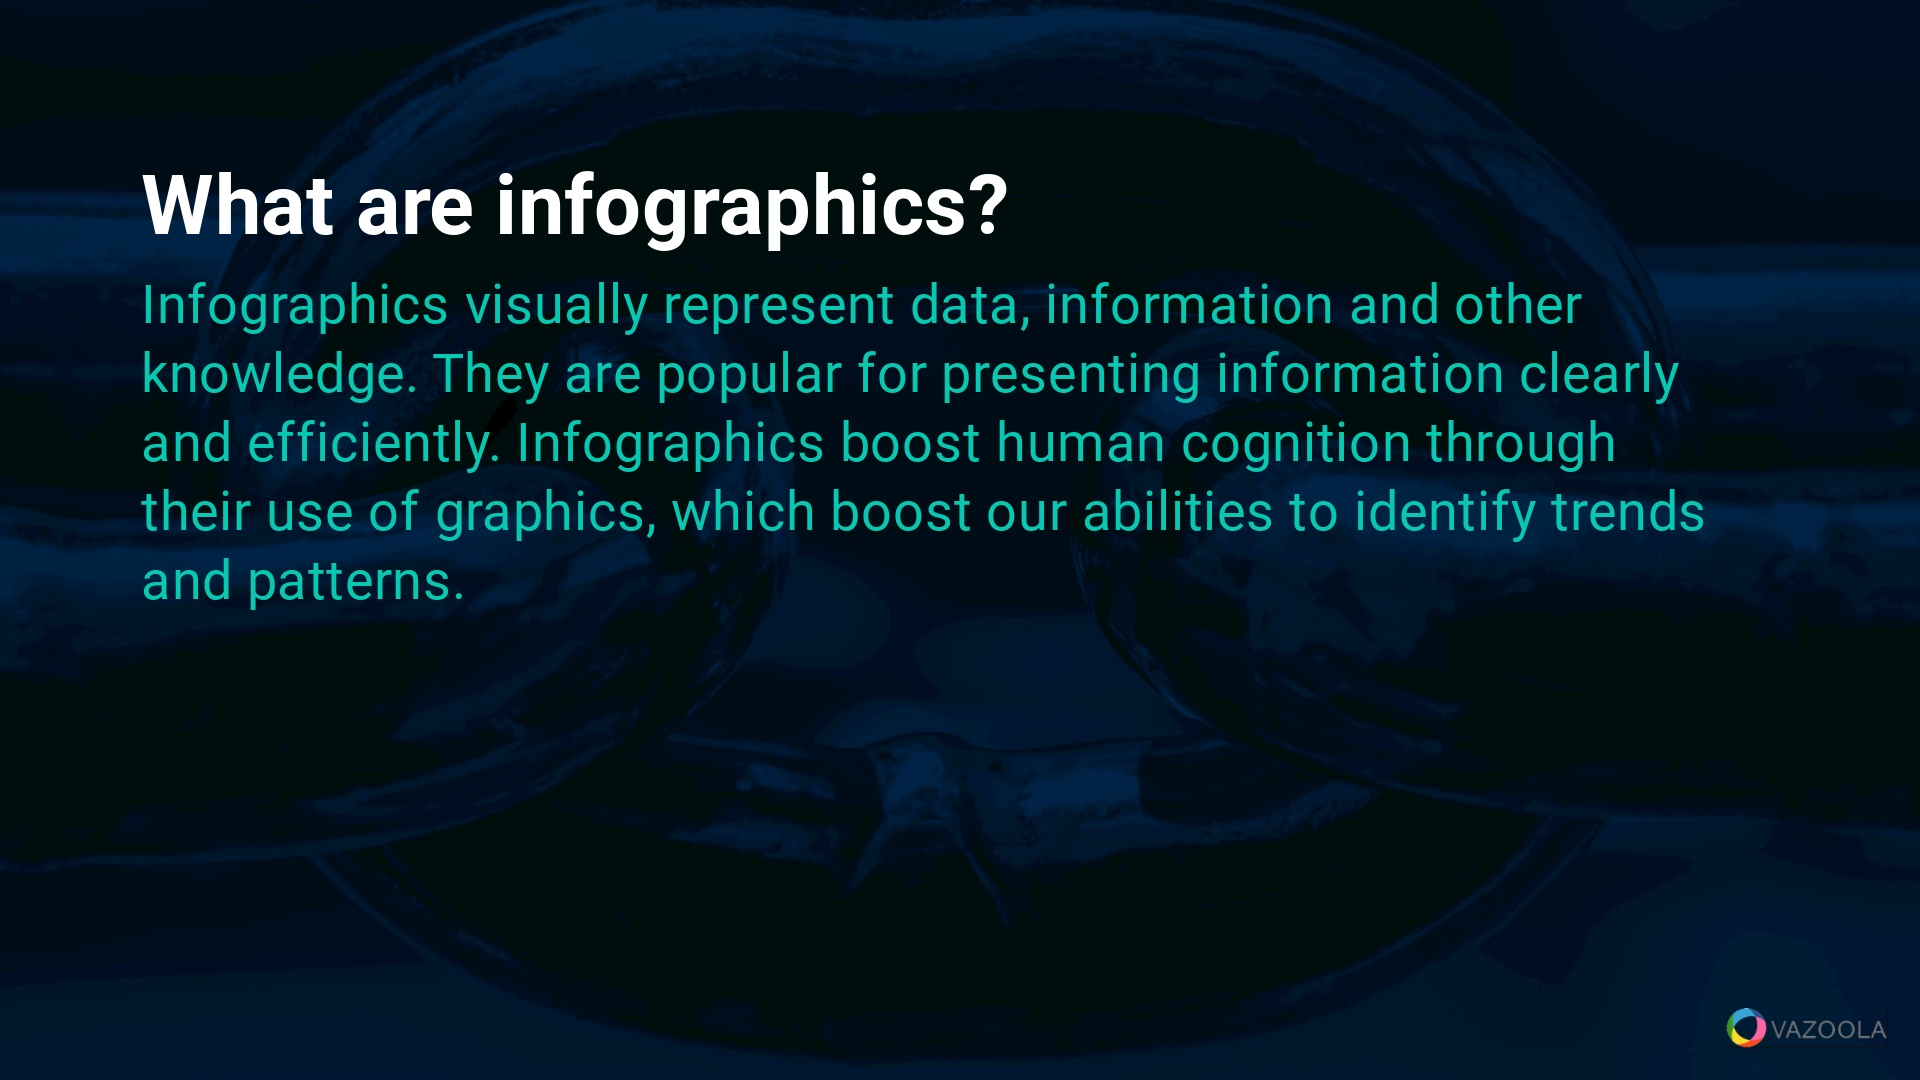
What Are Infographics?
The definition of infographic is a visual representation of facts, statistics and other data. It can take the shape of a chart, graph or other imagery that conveys the information.
A compelling infographic is easily share-able and appeals to a wide audience. It therefore serves as a powerful tool to attract attention and encourage more website traffic.
When other websites, blogs, or social media users share valuable infographics, it drives organic traffic and enhances a site's authority. This in turn boosts its Google search engine rankings.
Pro Tips:
Use A/B testing for different infographic styles and formats to determine which generates more shares and engagement, allowing for data-driven decisions in future infographic designs.
How Do Infographics Benefit SEO?
Do infographics provide any advantages to SEO campaigns?
Infographics offer a unique blend of visual appeal and informational value. The qualities significantly enhance a digital marketing strategy. In fact, Quicksprout found that infographics generate 37.5% more backlinks than a standard blog post.
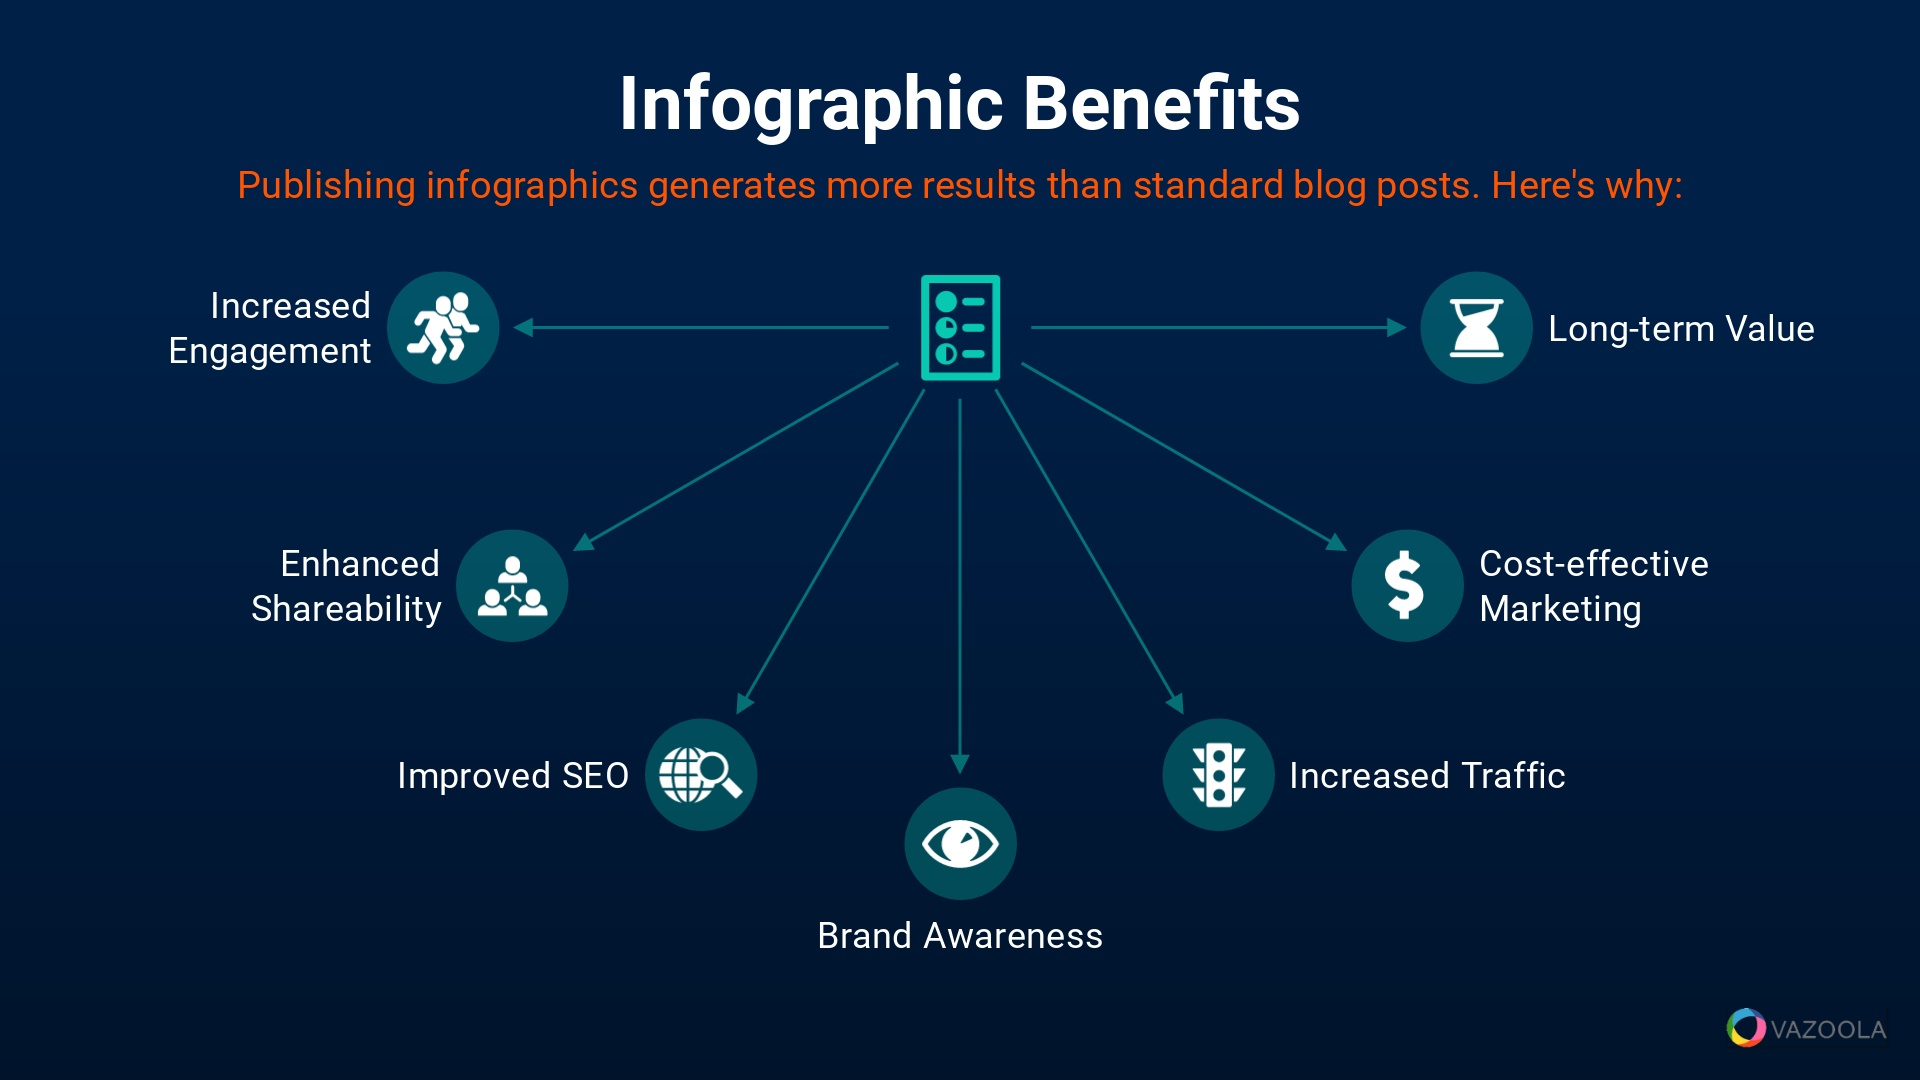
Specifically, how does an infographic benefit an SEO campaign? Consider the following advantages:
-
Increased Engagement: Compared to other tactics like writing a guest post, infographics are visually appealing and can simplify complex information. They are more engaging than text-heavy content.
-
Enhanced Share-ability: Thanks to their visual nature, infographics are easily shared across a variety of online properties. These include social media platforms, blogs, and other websites. We’ve observed that quality content that's easy to share tends to have a wider reach.
-
Improved SEO Performance: High-quality backlinks are a key ranking factor in search engines. Our company has seen significant SEO improvements from infographics.
-
Brand Awareness and Authority: Infographics help establish a brand as an authority in its field. By presenting valuable information in an accessible format, companies demonstrate their expertise and knowledge.
-
Long-Term Value: Unlike some forms of quality content, infographics can continue to attract attention and shares over time.
-
Increased Traffic: Infographics can drive significant traffic to a website. When widely shared, they attract viewers. Those same visitors then can explore other content on the site. In fact, content receives 12% more traffic when an infographic is included.
-
Cost-Effective Marketing: Compared to other marketing strategies, infographics can be relatively cost-effective. Our experience has shown a substantial return on investment for well-executed infographic campaigns.
What Are the Different Types of Infographics? (Infographic Examples)
There are several types of infographics, ranging from creative to investigative to statistical.
We’ve gathered five of the most common types of infographics. We hope they'll inspire ideas for your own visual storytelling.
No rule says you have to follow one style or another. In fact, the best infographics combine several styles.
Pro Tips:
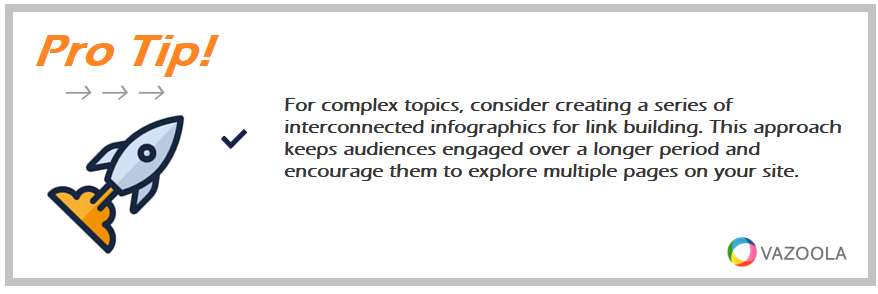
For complex topics, consider creating a series of interconnected infographics for link building. This approach keeps audiences engaged over a longer period and encourage them to explore multiple pages on your site.
Statistical Infographics
Source: absporu.ca

Source: absporu.ca
Statistical infographics are perfect for presenting data-driven insights in a visually compelling manner.
These images use charts, graphs, and other data visualization tools to make complex data more accessible and understandable.
Statistical infographics are particularly effective in showcasing surveys, research findings, or any data-heavy content. They simplify the data's interpretation and add a visual appeal lacking in text-based reports lack.
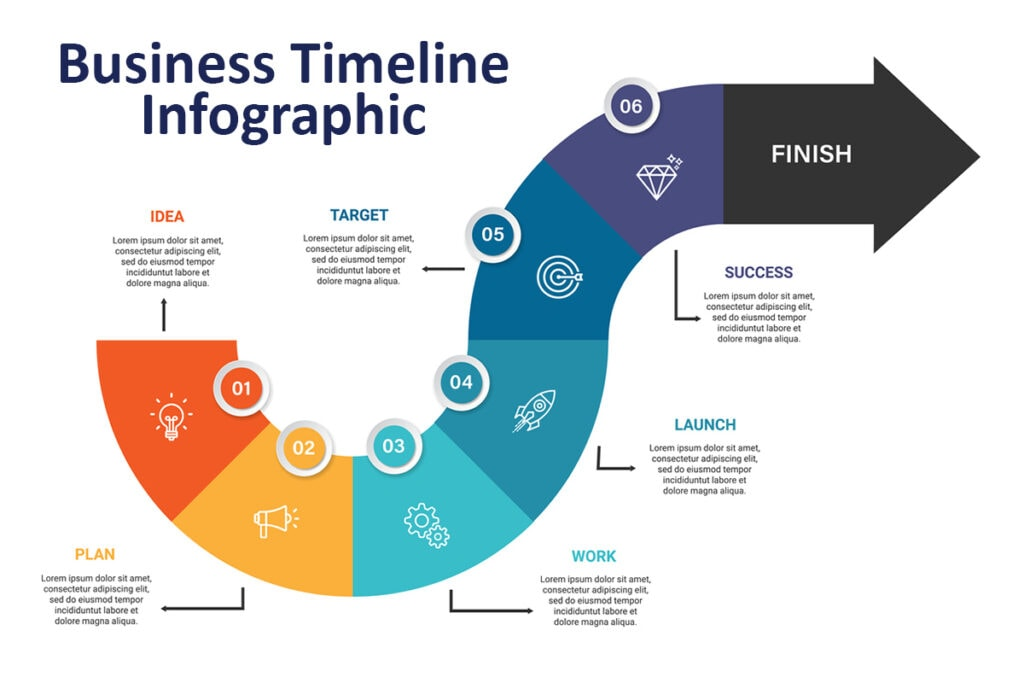
Timeline Infographics
Source: vickiesullivan.com
Timeline infographics display events or milestones in chronological order. They are perfect for telling a story and illustrating the history or evolution of a topic.
In our work at Vazoola, we've seen timeline infographics effectively capture an audience's attention. They accomplish this feat by providing a clear, linear narrative that is easy to follow.
Timeline infographics are especially useful for historical data, project timelines, or any content that benefits from a chronological perspective.
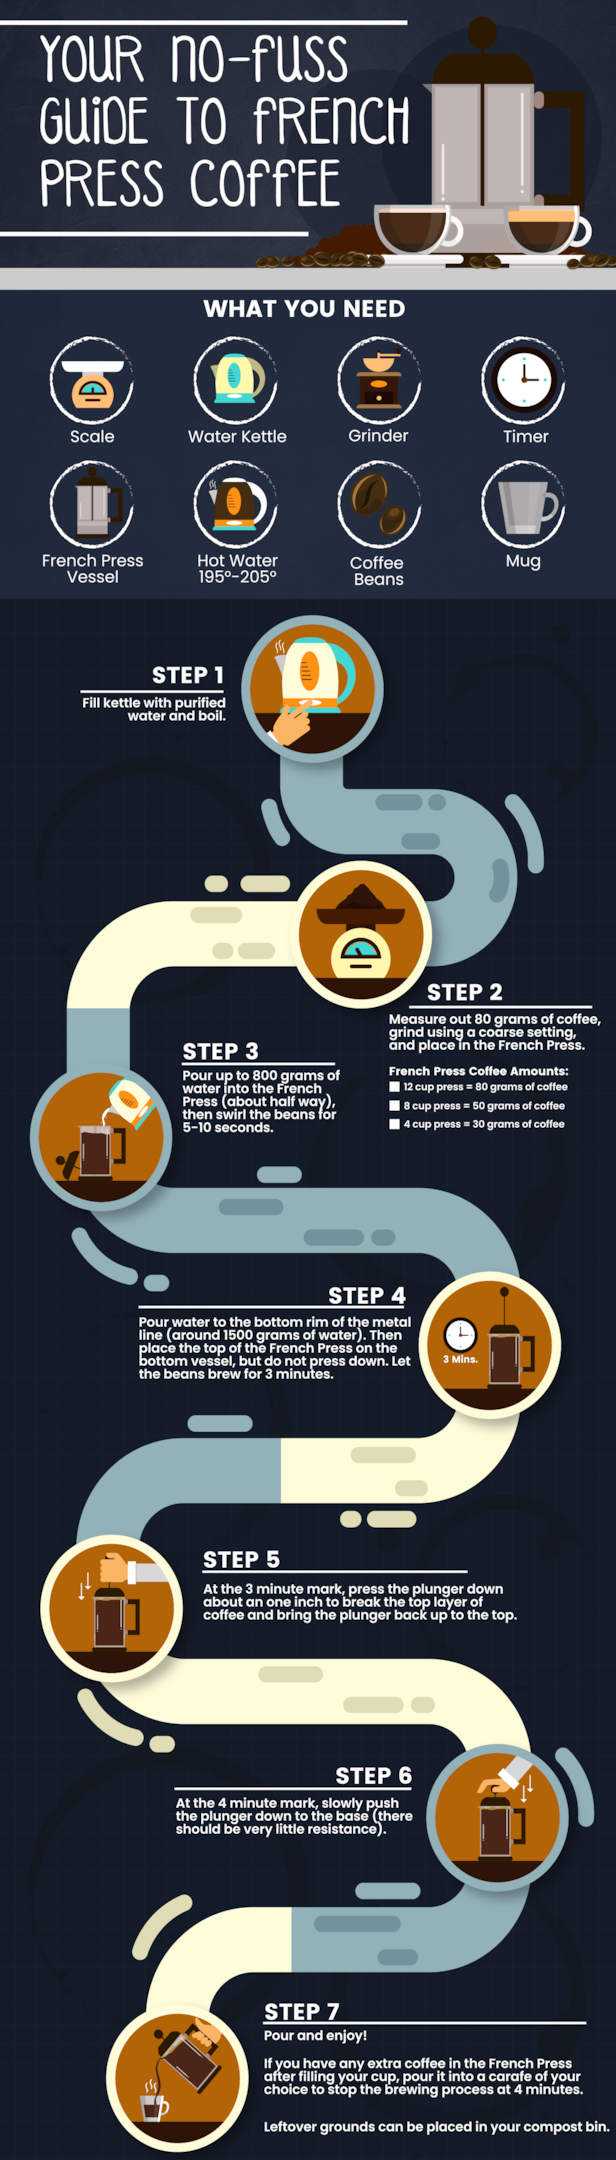
Process Infographics
Source: easel.ly
Process infographics break down complex procedures or workflows into easy-to-understand steps. They are invaluable for explaining intricate processes in a simple, visual format.
Successful SEO professionals often employ process infographics to clarify complicated concepts. this makes them more digestible for the audience.
The infographics are particularly beneficial for instructional content, how-to guides, or any information that involves a step-by-step process.
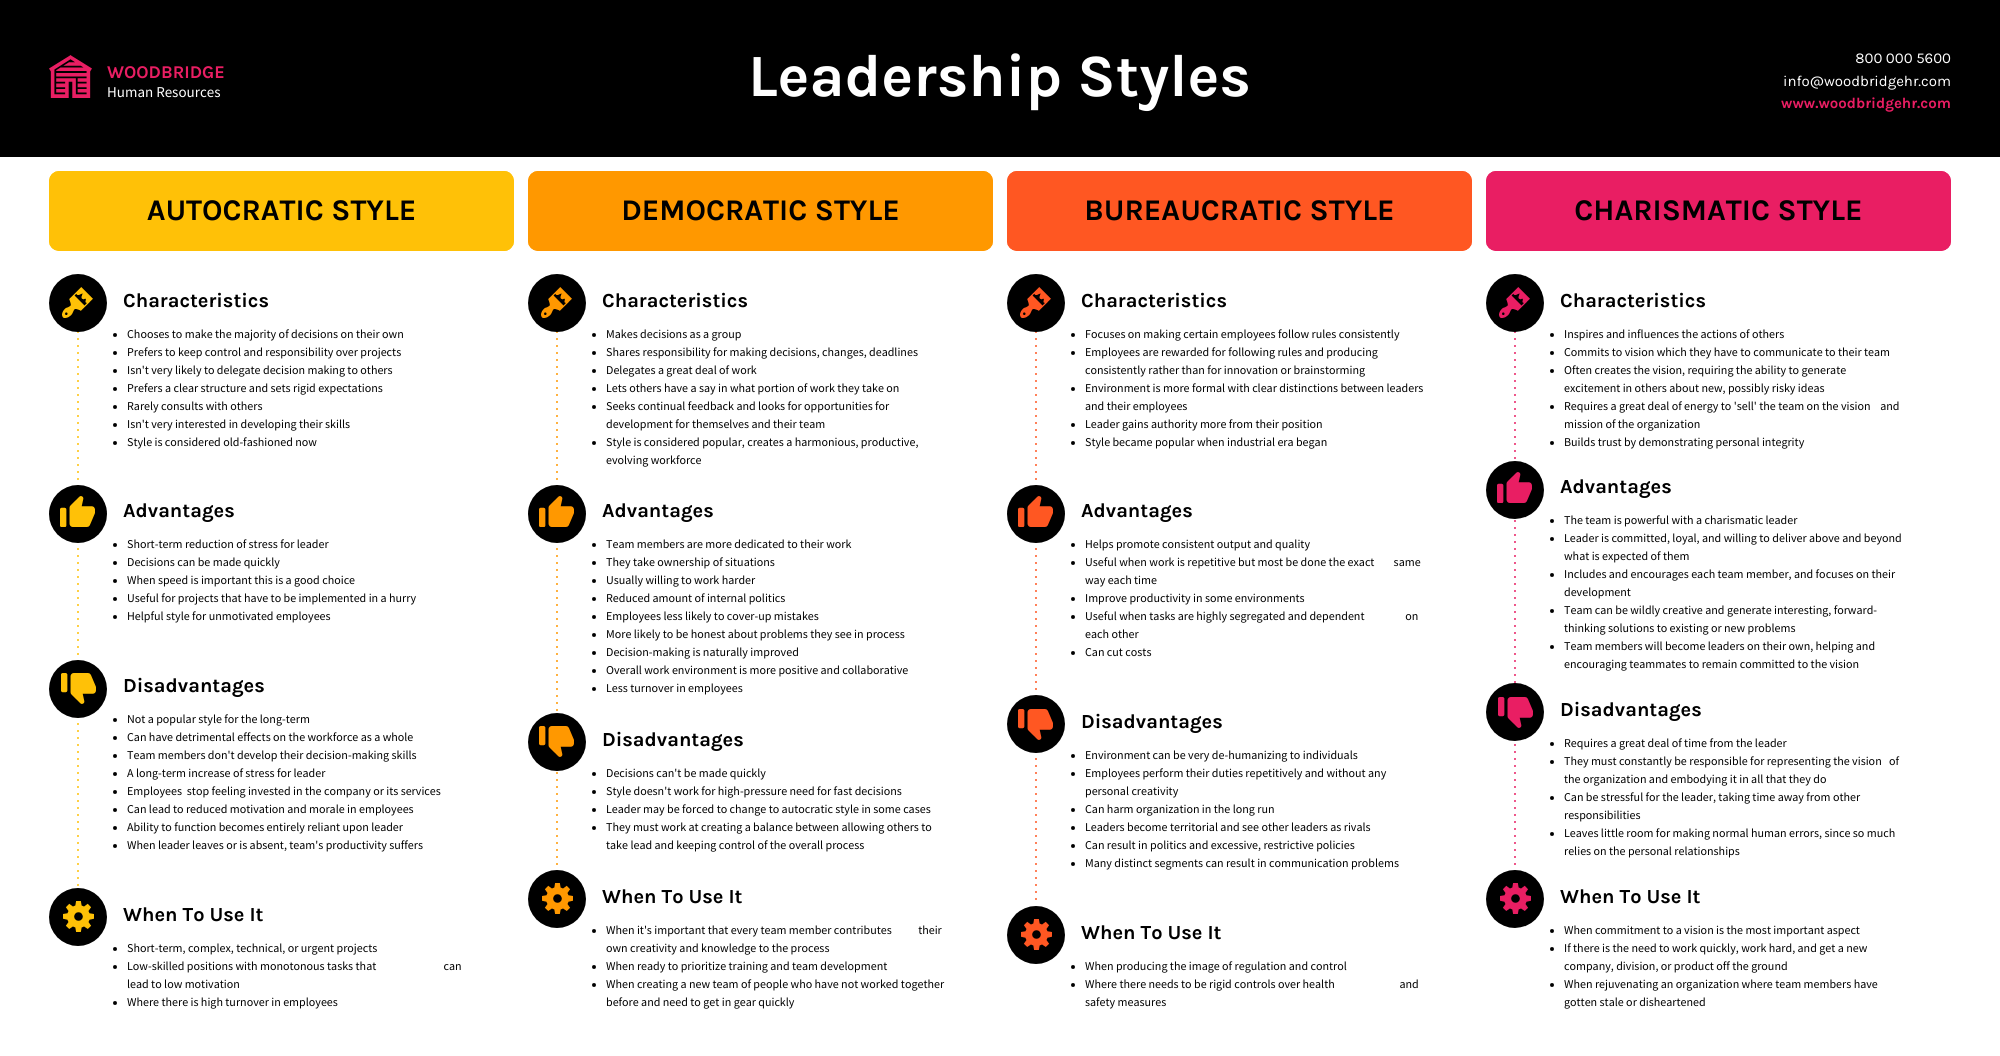
Comparison Infographics
Source: venngage.com
Comparison infographics juxtapose different options, ideas, or data sets.
The data visualizations are excellent at highlighting similarities and differences. They are a popular choice for product comparisons, pros and cons lists, or any content that involves contrasting elements.
We have seen comparison infographics effectively aid decision-making processes. They present information in a clear, comparative format.
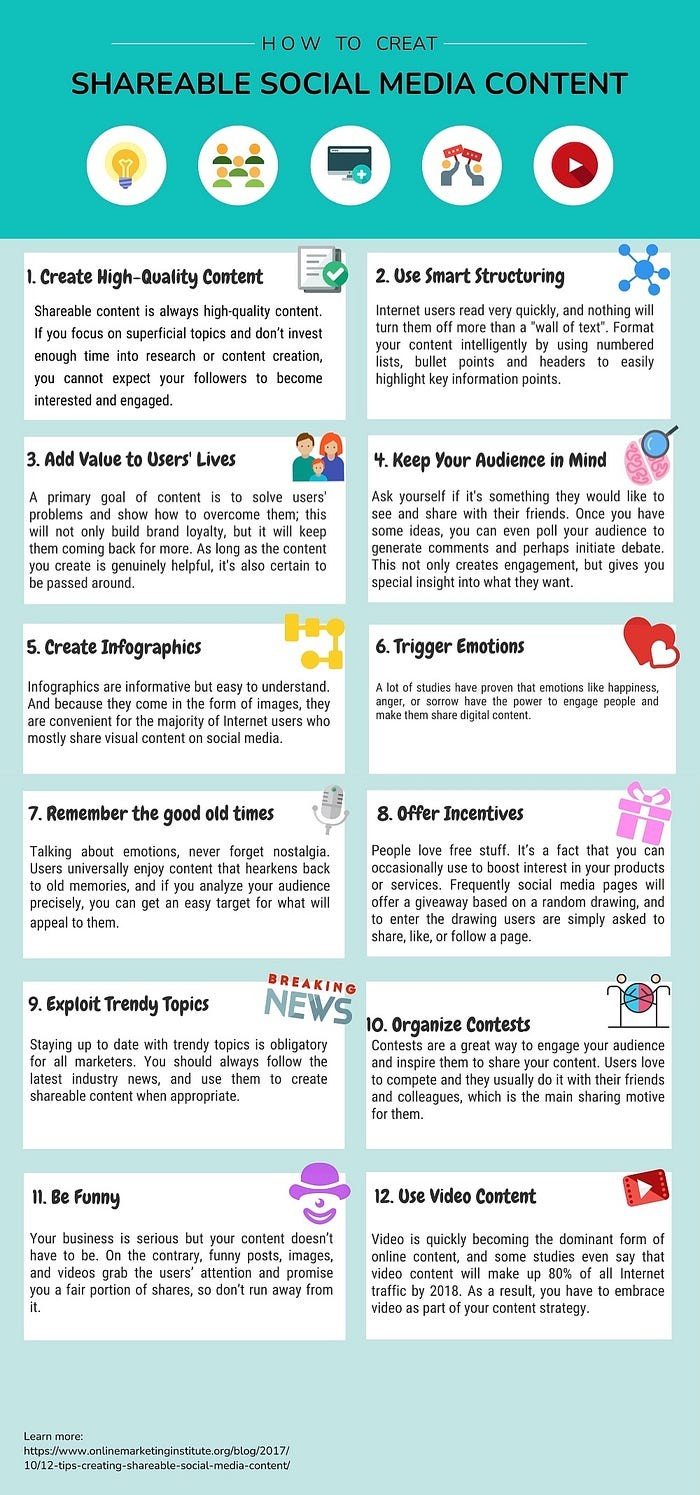
List Infographics
Source: medium.com
List infographics organize information into a clear, numbered or bulleted format.
They are perfect for summarizing key points, tips, or any information that benefits from a structured layout.
In the realm of SEO, list infographics are highly effective at capturing the audience's attention. They do so thanks to their straightforward and organized presentation.
Hierarchical Infographics
Source: venngage.com
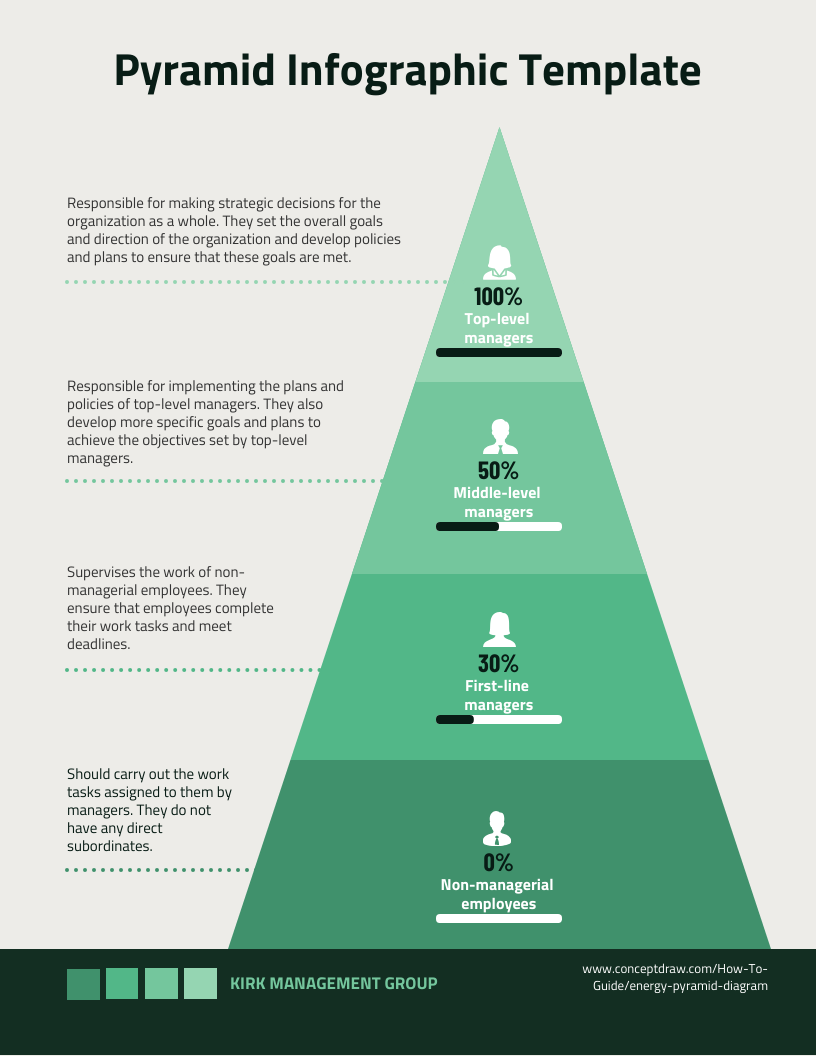
Hierarchical infographics display information according to levels of importance or organizational structure.
The infographics illustrate organizational charts, categorize information, and illustrate any content in which hierarchy plays a key role.
Site owners often find that hierarchical infographics are particularly effective at presenting layered information in a clear and concise manner.
Geographic Infographics
Source: visualcapitalist.com
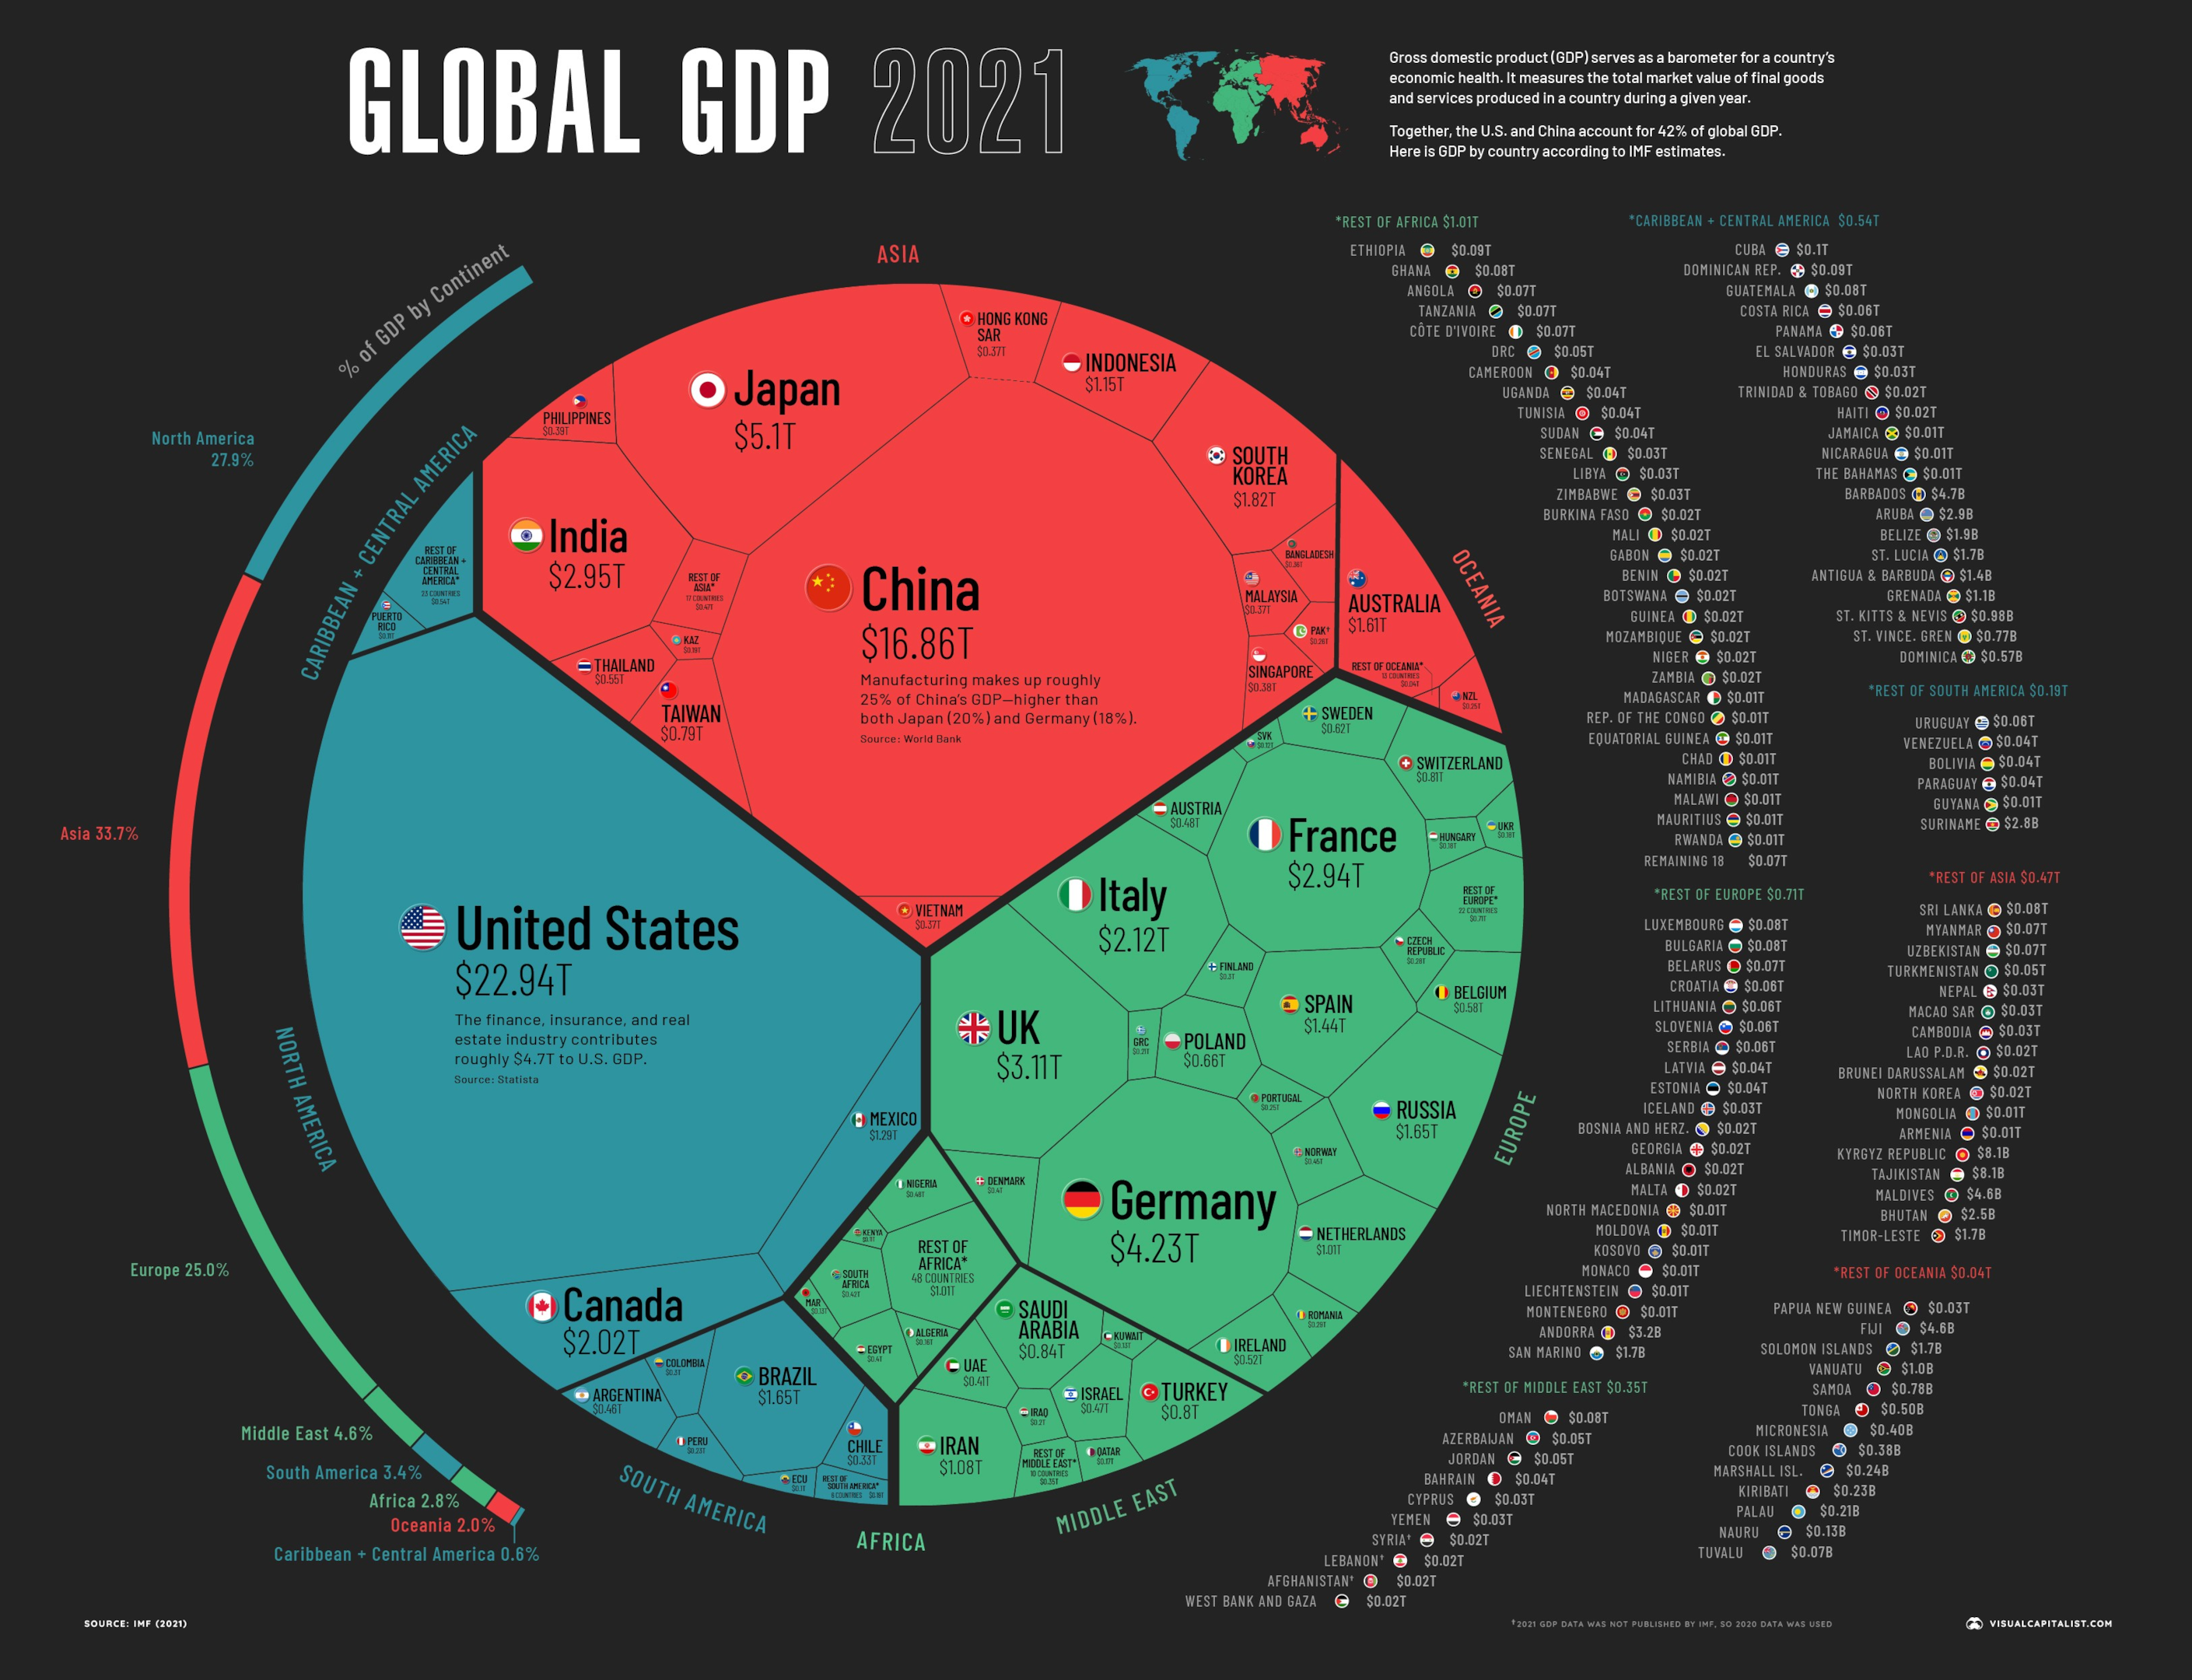
Geographic infographics present location-based data or information.
They often incorporate maps and spatial references to highlight geographical trends, distributions, or relationships.
When used for link building, geographic infographics effectively communicate data tied to specific locations. It makes geographic infographics invaluable for market analysis, demographic studies, or any content with a geographic component.
What Makes an Awesome SEO Infographic?
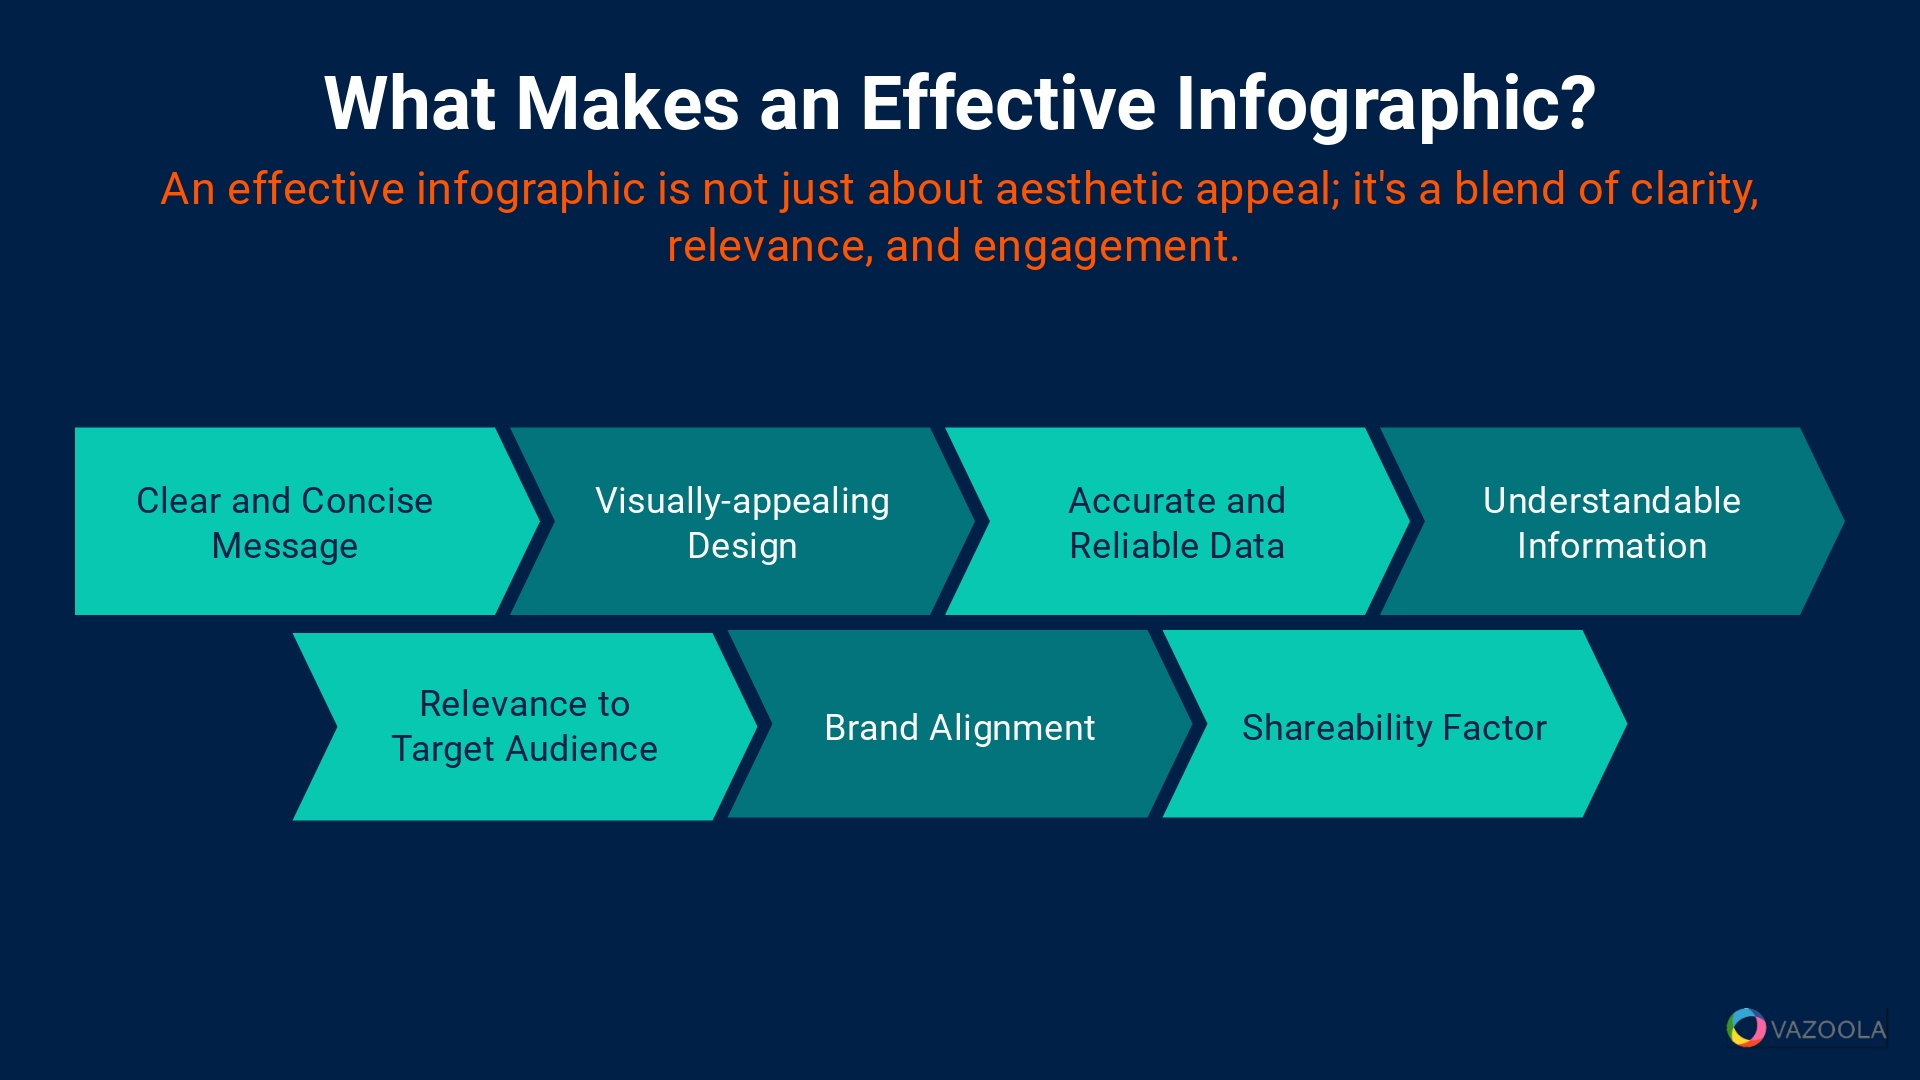
What makes an exceptional infographic for SEO? What are its critical elements? An effective infographic is more than aesthetic appeal; it's a blend of clarity, relevance, and engagement.
An effective infographic transforms complex data into an easily digestible format. That way, it's informative and shareable.
This balance is key to make sure the infographic serves its purpose in an SEO strategy. That way, it attracts both attention and shares.
What makes an infographic successful?
-
Clear and Concise Message: The best infographics convey a clear message without overwhelming the viewer. They focus on a central idea and present it in a straightforward manner. Such a clarity in message significantly enhances the infographic's effectiveness.
-
Visually Appealing Design: Aesthetics play a crucial role in attracting and retaining viewer attention. Effective infographics use a harmonious color scheme, legible typography, and balanced layout. A well-designed infographic can make even the most mundane data visually engaging.
-
Accurate and Reliable Data: The information presented must be accurate and sourced from reliable references. Infographics with credible data establish trust and authority, which is key to content worth sharing.
-
Understandable Information: The infographic should simplify complex information, not complicate it. The graphic should break down data into easily digestible segments, making it accessible to a broad audience. We recommend using straightforward language and clear visuals.
-
Relevance to the Target Audience: The content of the infographic must resonate with its intended audience. Understanding the audience's interests and needs is key to creating infographics that capture and hold their attention. Our experience has shown that relevance matters to people who share content.
-
Brand Alignment: The infographic should align with a brand's identity and message. Consistent use of brand colors, logos, and messaging reinforces brand recognition and loyalty. Remember, brand-aligned infographics not only boost SEO but also enhance overall brand strategy.
-
Share-ability Factor: An effective infographic is designed with share-ability in mind. It should be easy to share across various platforms, including social media, blogs, and relevant websites. Infographics with a high share-ability factor significantly increase SEO opportunities.
Pro Tips:
Integrate interactive elements in your infographics, such as clickable links or hover-over information boxes, to increase user engagement and encourage longer site visits, which can positively impact SEO rankings.
How to Build an Impactful Infographic
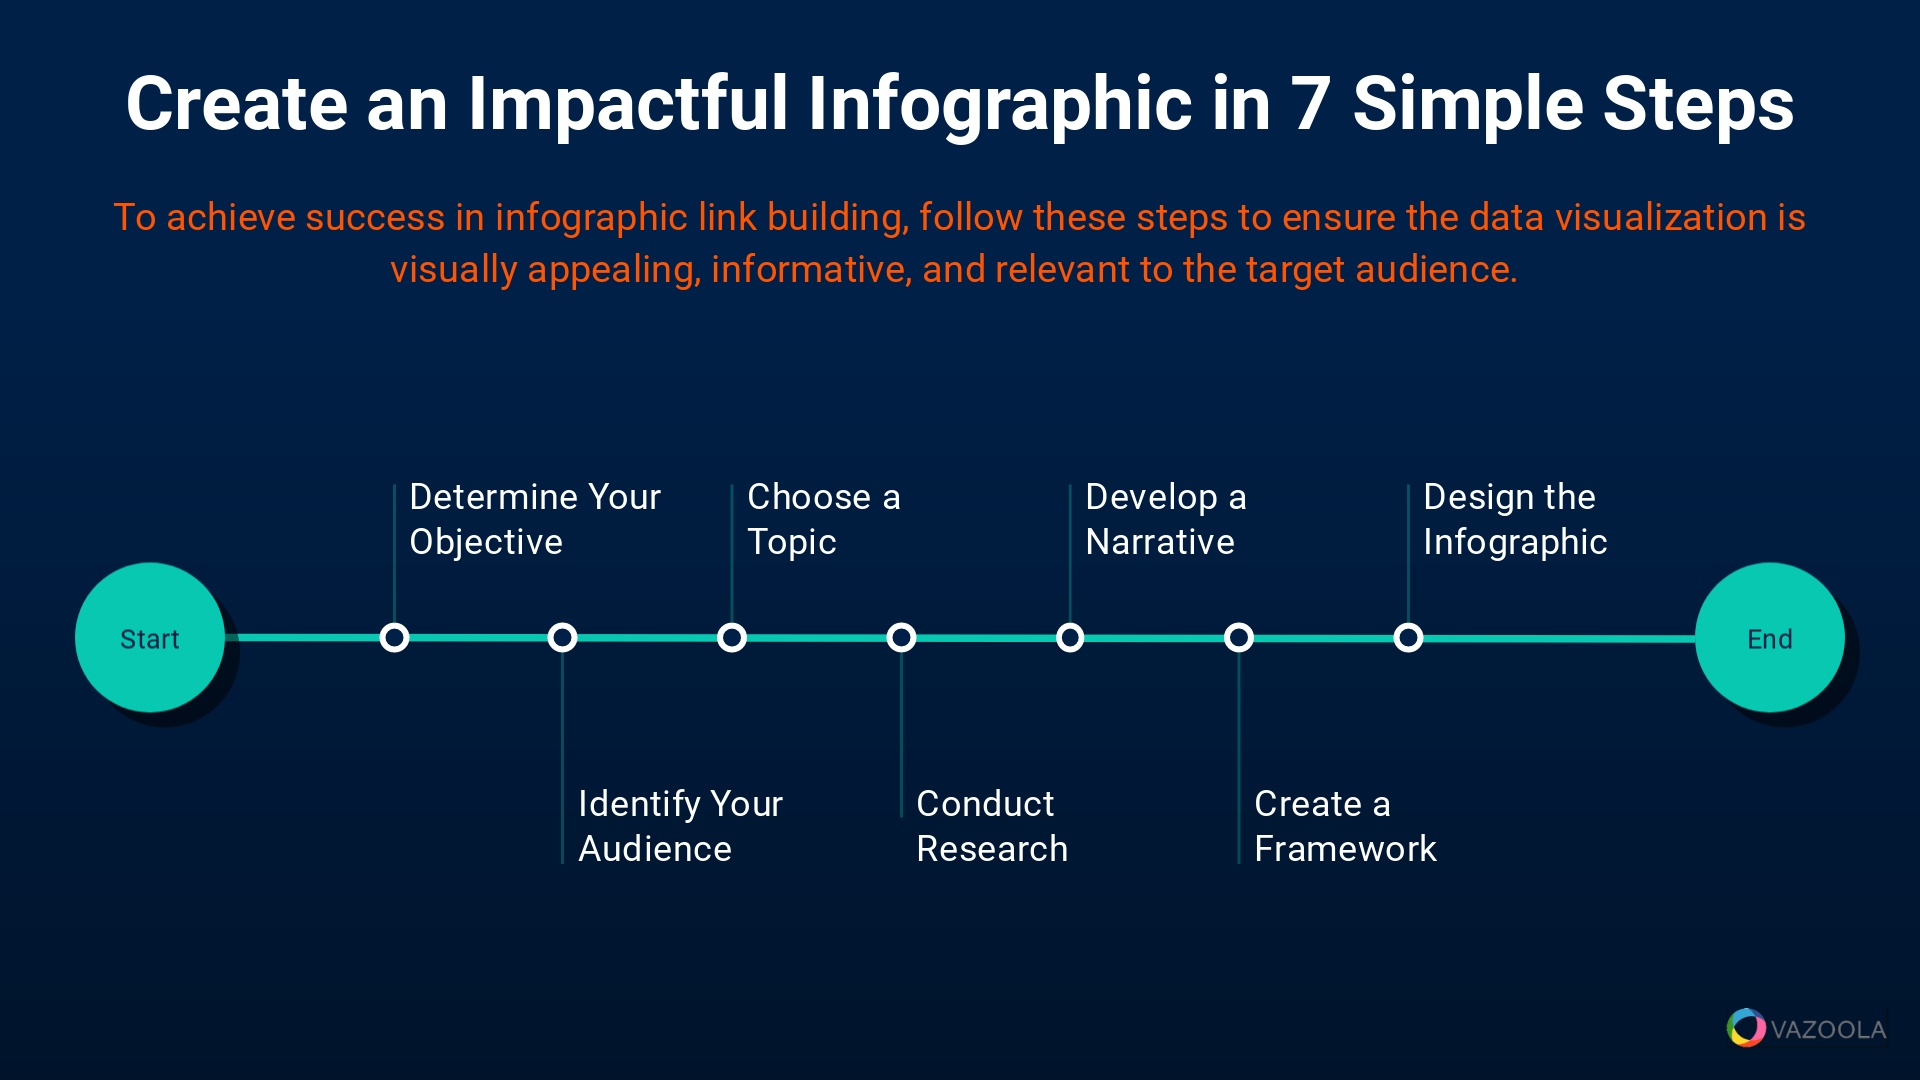
Creating an impactful and compelling infographic is a strategic process that requires careful planning and execution. That doesn't, however, mean you have to be a professional graphic designer to make one.
To achieve this, it's essential to follow a series of steps that ensure the infographic content is not only visually appealing but also informative and relevant to readers.
Stick with us as we outline the key steps in creating an infographic that resonates with viewers and encourages sharing.
1. Determine Objective
The first step in creating an impactful infographic is clearly defining its objective. What do you want to achieve with this infographic?
It could be to educate the audience, promote a product, or illustrate industry trends.
Our experience has shown that having a clear objective guides the content and design of an infographic, ensuring it meets its intended purpose.
2. Identify Your Target Audience
It's crucial to understand who the infographic is targeting.
Different audiences have varying preferences and needs. At Vazoola, we recommend conducting audience research to understand their interests, challenges, and information consumption habits.
This insight helps in creating an infographic that truly resonates with its intended viewers.
3. Choose a Topic
Selecting the right topic is key to the success of an infographic.
The topic should align with both the objective and the target audience's interests.
We suggest choosing topics that are timely, relevant, and offer value to the audience. A well-chosen topic can significantly increase the infographic's appeal and share-ability.
4. Conduct Research
Once the topic is chosen, the next step is to gather accurate and reliable data.
This process might involve collecting statistics, trends, or expert opinions.
Our company emphasizes the importance of using credible sources to ensure information is trustworthy and authoritative, essential for building credibility.
5. Develop a Narrative
An effective infographic tells a story.
Developing a narrative helps organize information in a logical and engaging manner.
A strong narrative, including a clear story arc, makes the infographic more compelling and easier to understand, enhancing its overall impact.
6. Create a Framework
Before you create infographics, it's important to design a framework.
Doing so involves outlining the layout, deciding on the types of visuals — including charts, graphs, illustrations — and planning the flow of information.
Keep in mind that this well-thought-out framework serves as a blueprint for a successful infographic.
7. Design the Infographic
The final step is the design process. This is where the narrative and data visually come to life.
The design should be visually appealing, reflect the brand identity, and, most importantly, clearly communicate the message.
We recommend keeping the design simple, uncluttered, and focused on the key message to ensure the infographic is effective and engaging.
Pro Tips:
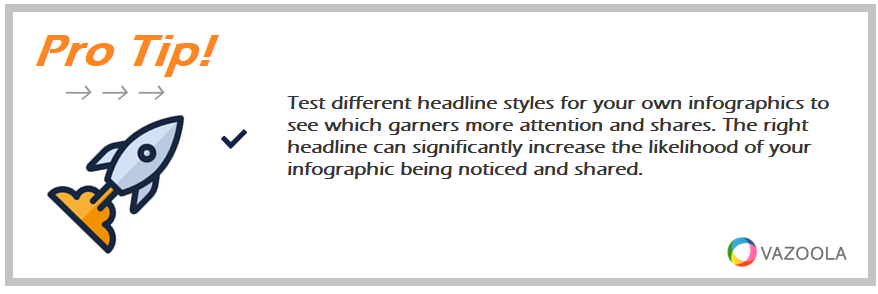
Test different headline styles for your own infographics to see which garners more attention and shares. The right headline can significantly increase the likelihood of your infographic being noticed and shared.
Infographic Tips and Best Practices
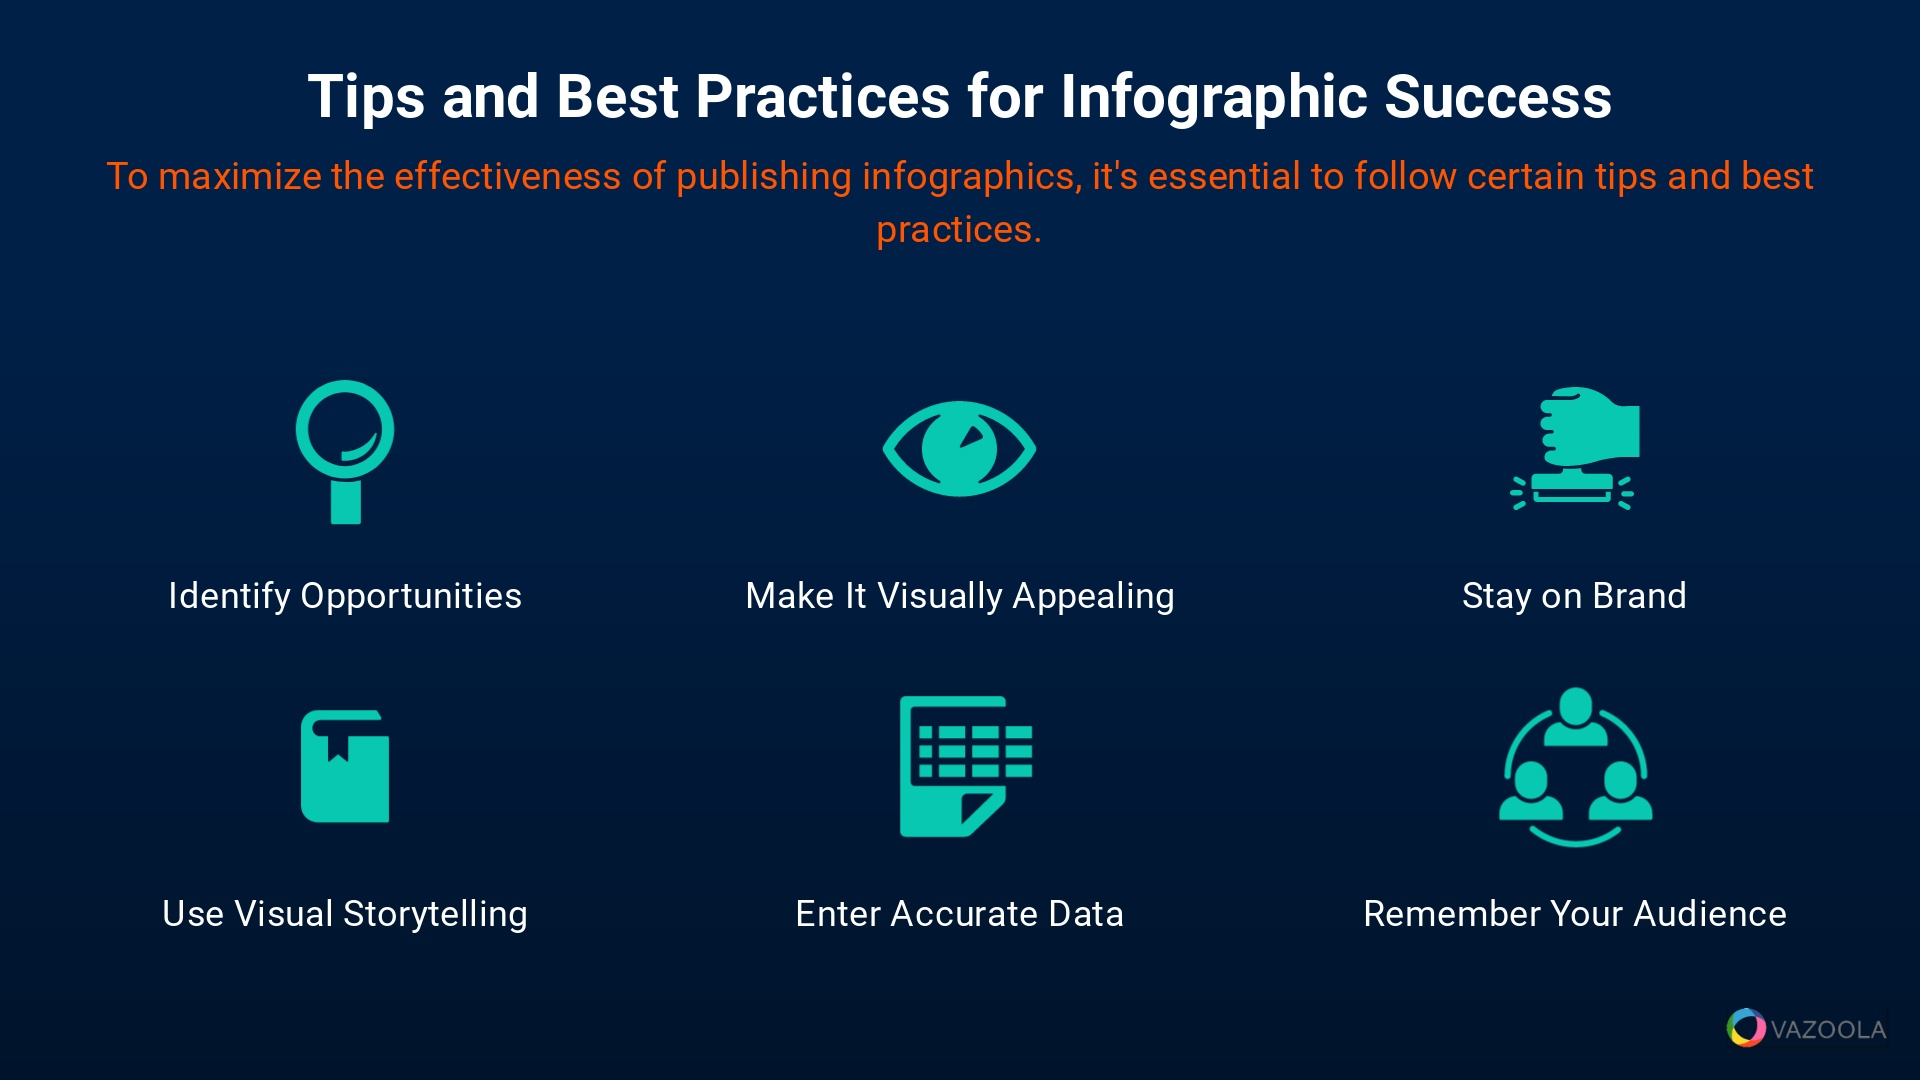
To maximize the power of infographics, it's essential to follow certain tips and best practices.
At Vazoola, we have honed our strategies over time, learning what works best in various scenarios.
Pro Tips:
Regularly revisit and update your most successful existing infographics with current data and trends. This refresh can reinvigorate interest and sharing, leading to new backlinks even from an older piece of content.
Generate Infographic Ideas
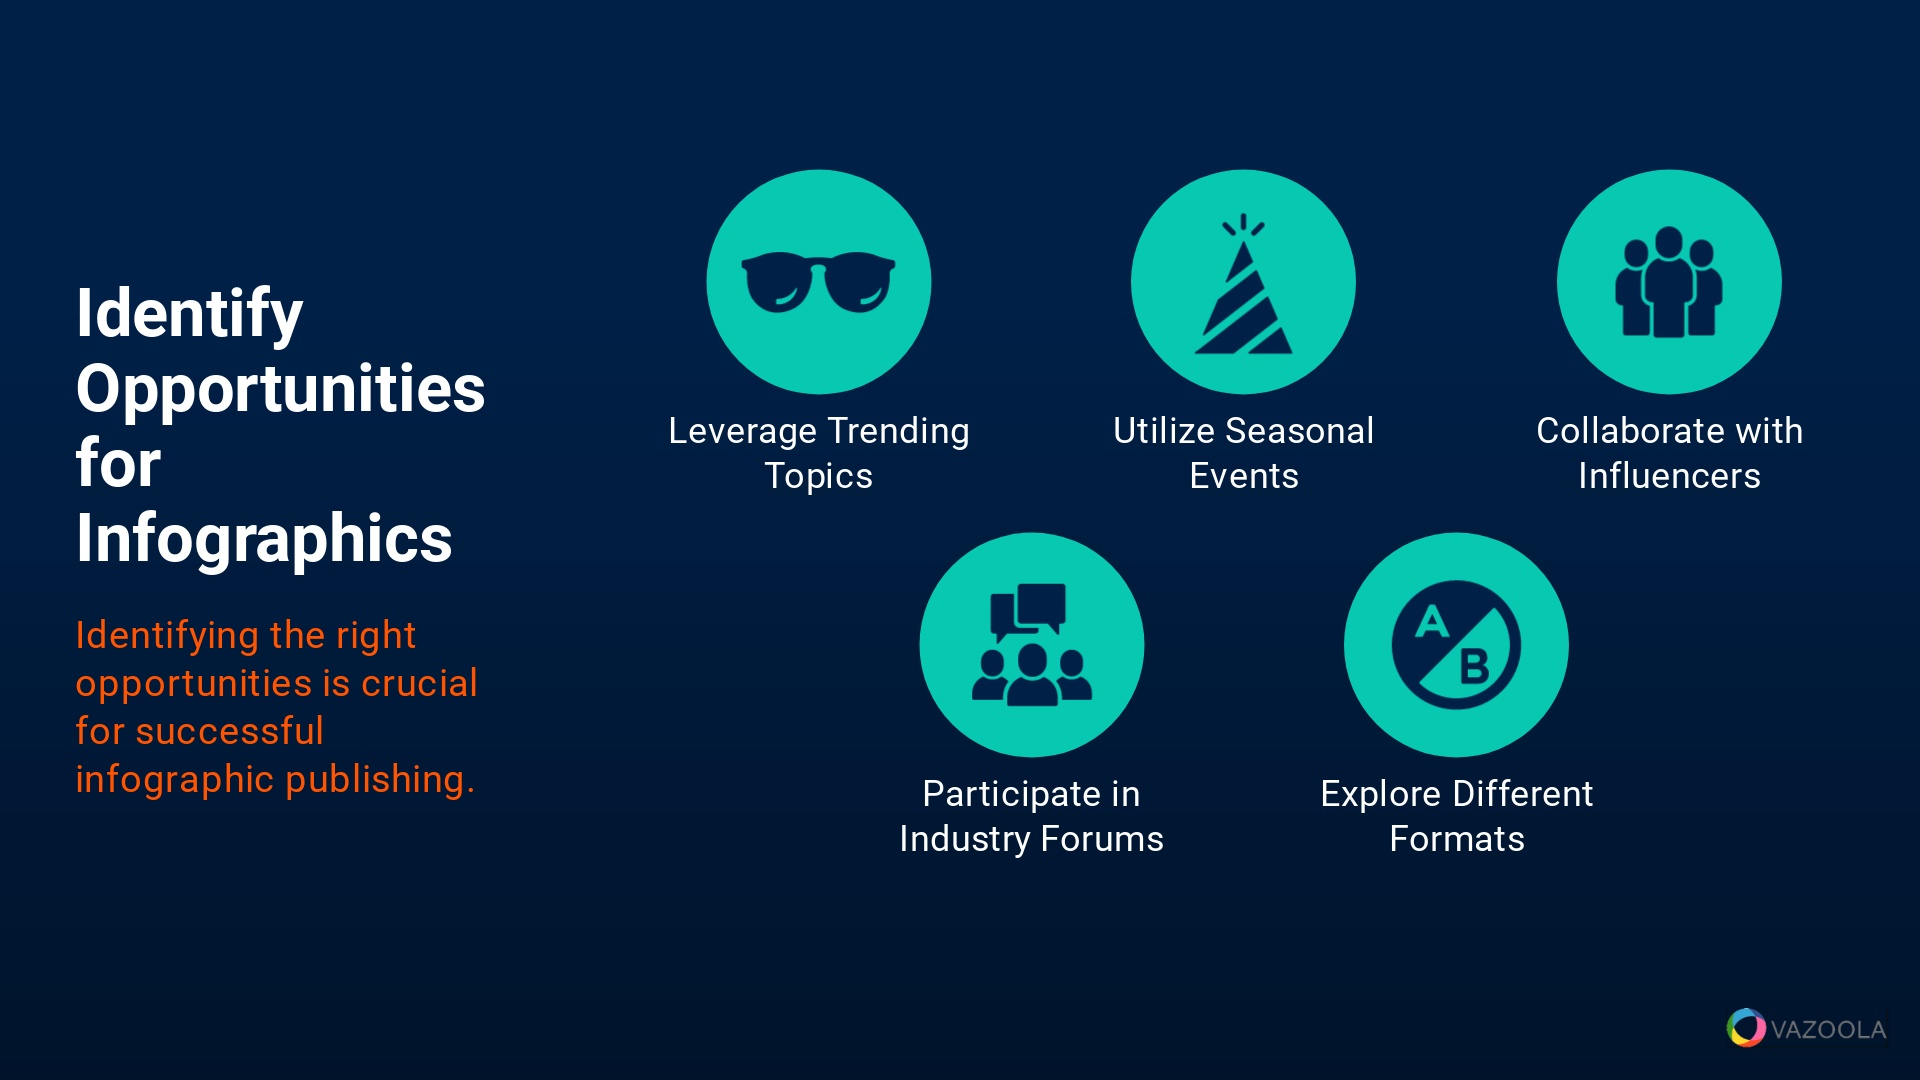
Identifying the right opportunities is crucial for successful infographic creation and link building. Here are a few opportunities to consider:
-
Leverage Trending Topics: Stay abreast of current trends and create infographics that align with these topics. Infographics based on trending topics often get more shares because of their timely relevance.
-
Use Seasonal Events: Capitalize on seasonal events or holidays to create themed infographics. These often attract attention thanks to their timely nature, which can lead to increased sharing from other sites.
-
Collaborate with Influencers: Partner with influencers in your niche to co-create or promote your infographics. Doing so can significantly extend your reach from new and diverse sources.
-
Participate in Industry Forums and Discussions: Engage in industry forums and discussions to identify an information gap that your infographics can fill. This approach can lead to natural content sharing opportunities.
Explore Different Formats: Experiment with different infographic formats to see which resonates best with your audience. Our company has learned that variety can lead to broader appeal and more linking opportunities.
Create Shareable Content
Share-ability can make all the difference in successful content creation. What motivates other websites to share your infographic?
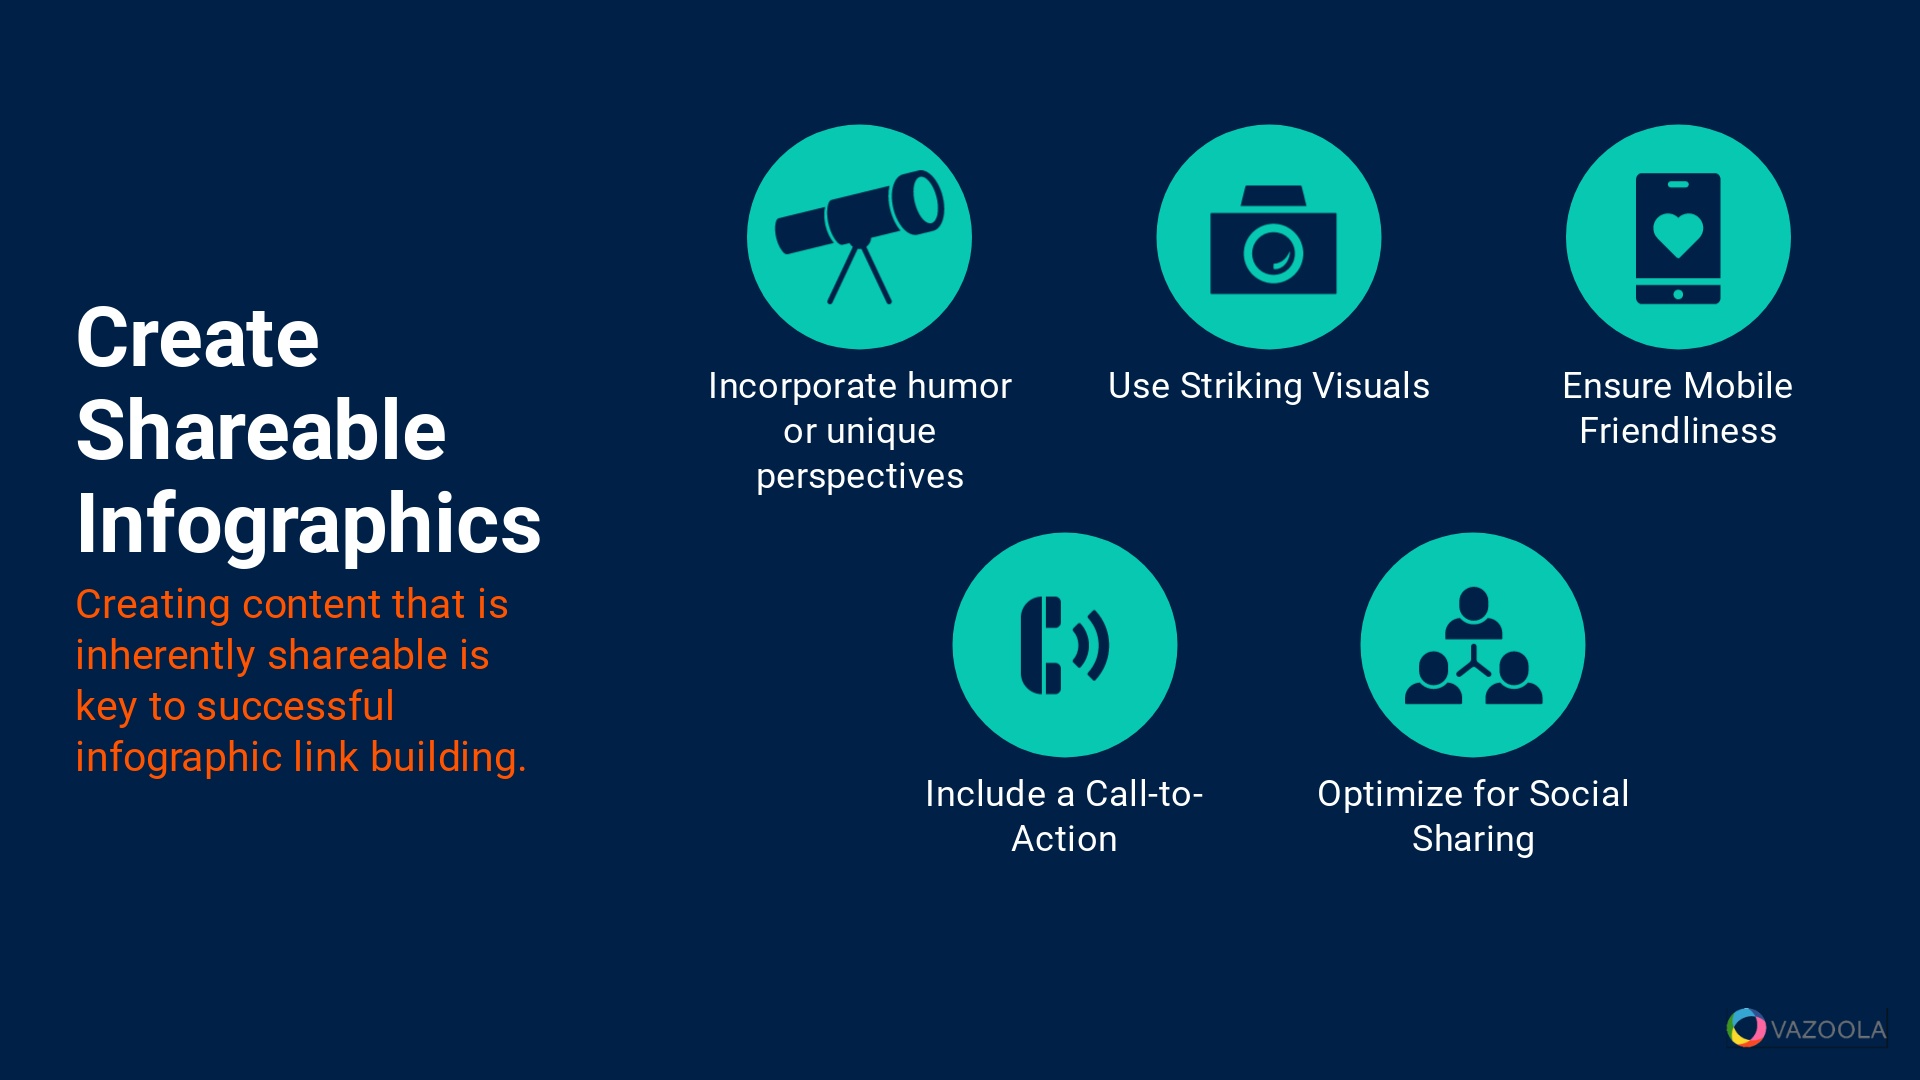
Creating quality content that is inherently share-worthy is key for successful SEO with infographics. The following five tips will help you along your way:
-
Incorporate Humor or Unique Perspectives: Infographics with a touch of humor or a unique angle often get more shares. We suggest balancing professionalism with creativity to make your content stand out.
-
Use Striking Visuals: Eye-catching visuals are crucial for share-ability. Our experience has shown that infographics with strong visual elements are more likely to be shared.
-
Ensure Mobile-Friendliness: With the increasing use of mobile devices, it's important to make sure your infographics are mobile-friendly. We recommend optimizing for different screen sizes to enhance share-ability.
-
Include a Call-to-Action: Encourage sharing by including a clear call-to-action in your infographic. Our company has found that a well-placed CTA can significantly increase the likelihood of your content being shared.
Optimize for Social Sharing: Make it easy for viewers to share your infographic on social media. We suggest including social sharing buttons and optimizing the layout for social platforms.
Build Relationships
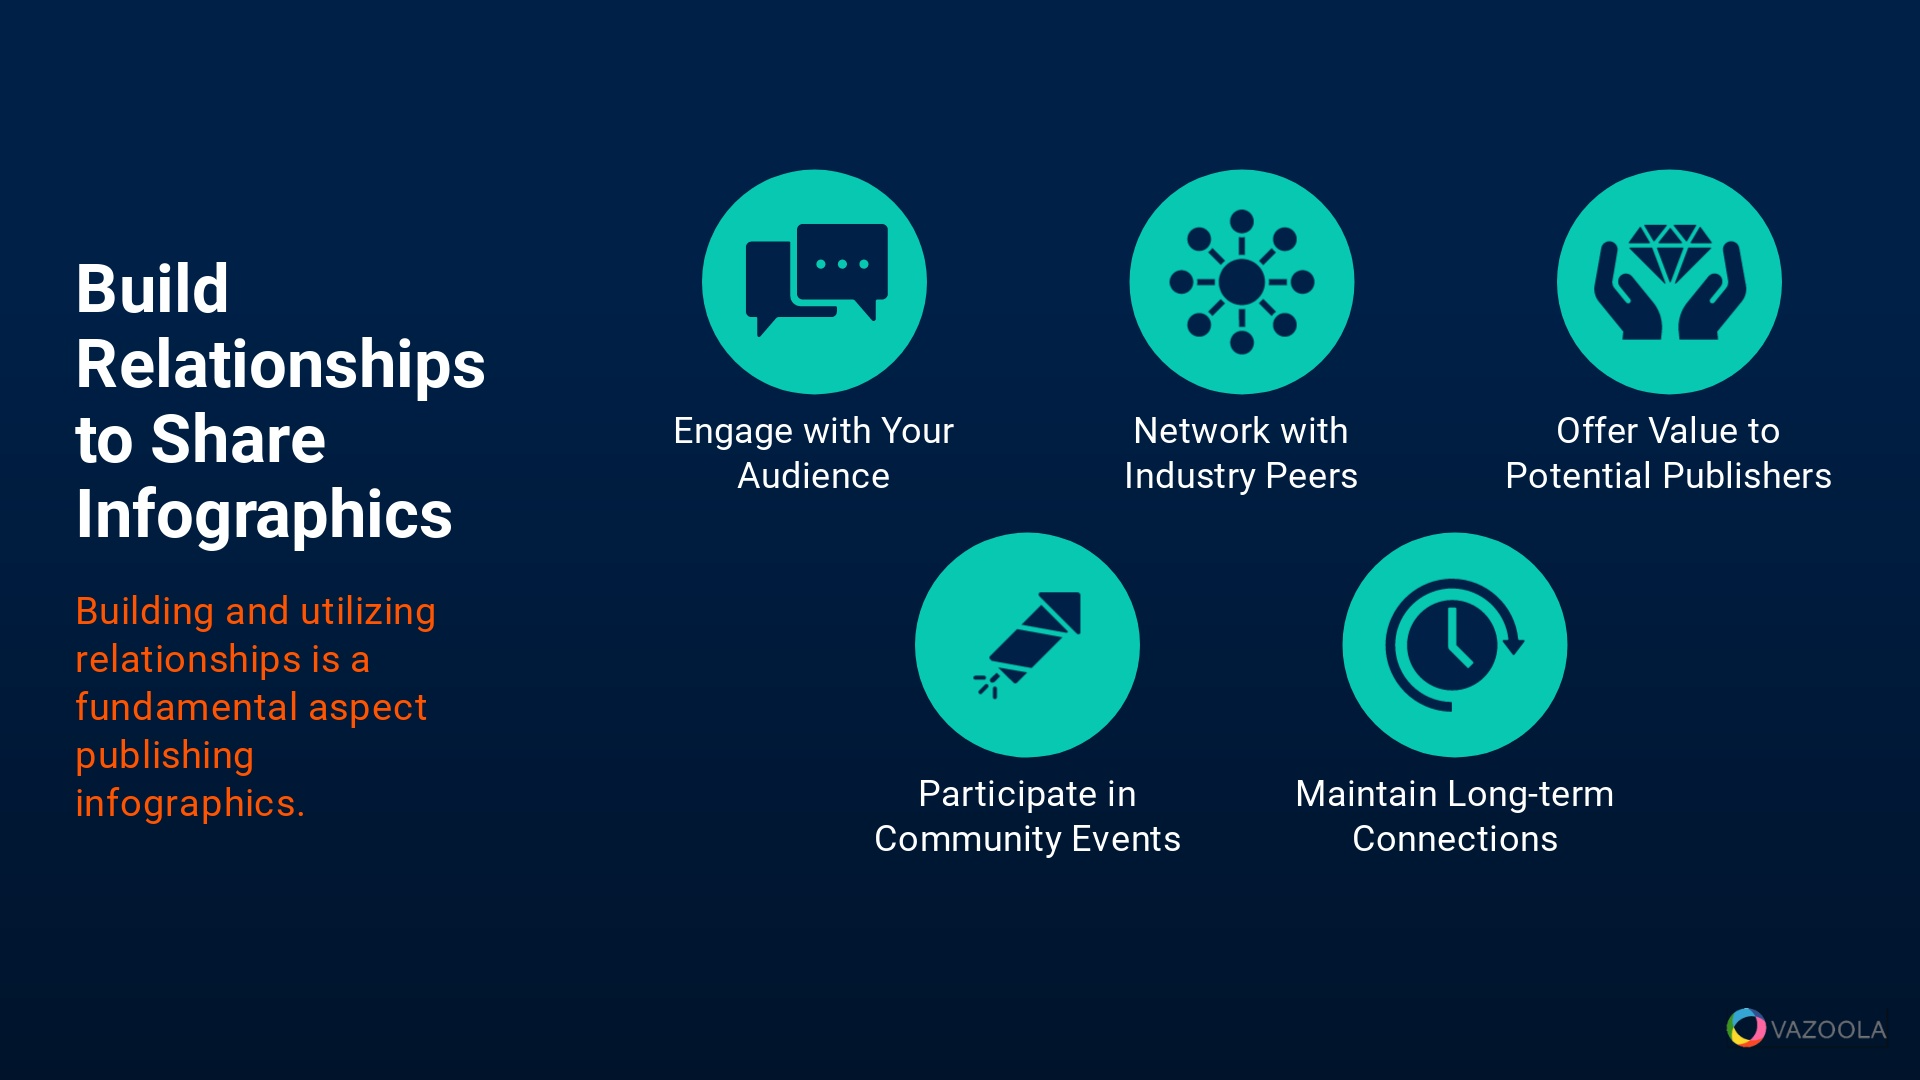
Building and using relationships is a fundamental aspect of any content marketing strategy. Consider the following tips to help forge and keep fruitful professional relationships:
-
Engage with Your Audience: Regularly interact with your audience on social media and other sites. We have seen that engagement can lead to stronger relationships and more organic shares.
-
Network with Industry Peers: Establish connections with peers in your industry. Our experience shows that these relationships can lead to collaborative opportunities and mutual sharing of content.
-
Offer Value to Potential Linkers: When requesting shares, offer something of value in return. We recommend providing useful insights or offering to share their content in exchange.
-
Participate in Community Events: Get involved in community events, webinars, or workshops. These activities help build relationships and open up new linking opportunities.
Maintain Long-Term Connections: Focus on maintaining long-term relationships rather than one-time interactions. We have learned that sustained connections often lead to ongoing mutual content sharing opportunities.
Avoid Common Mistakes
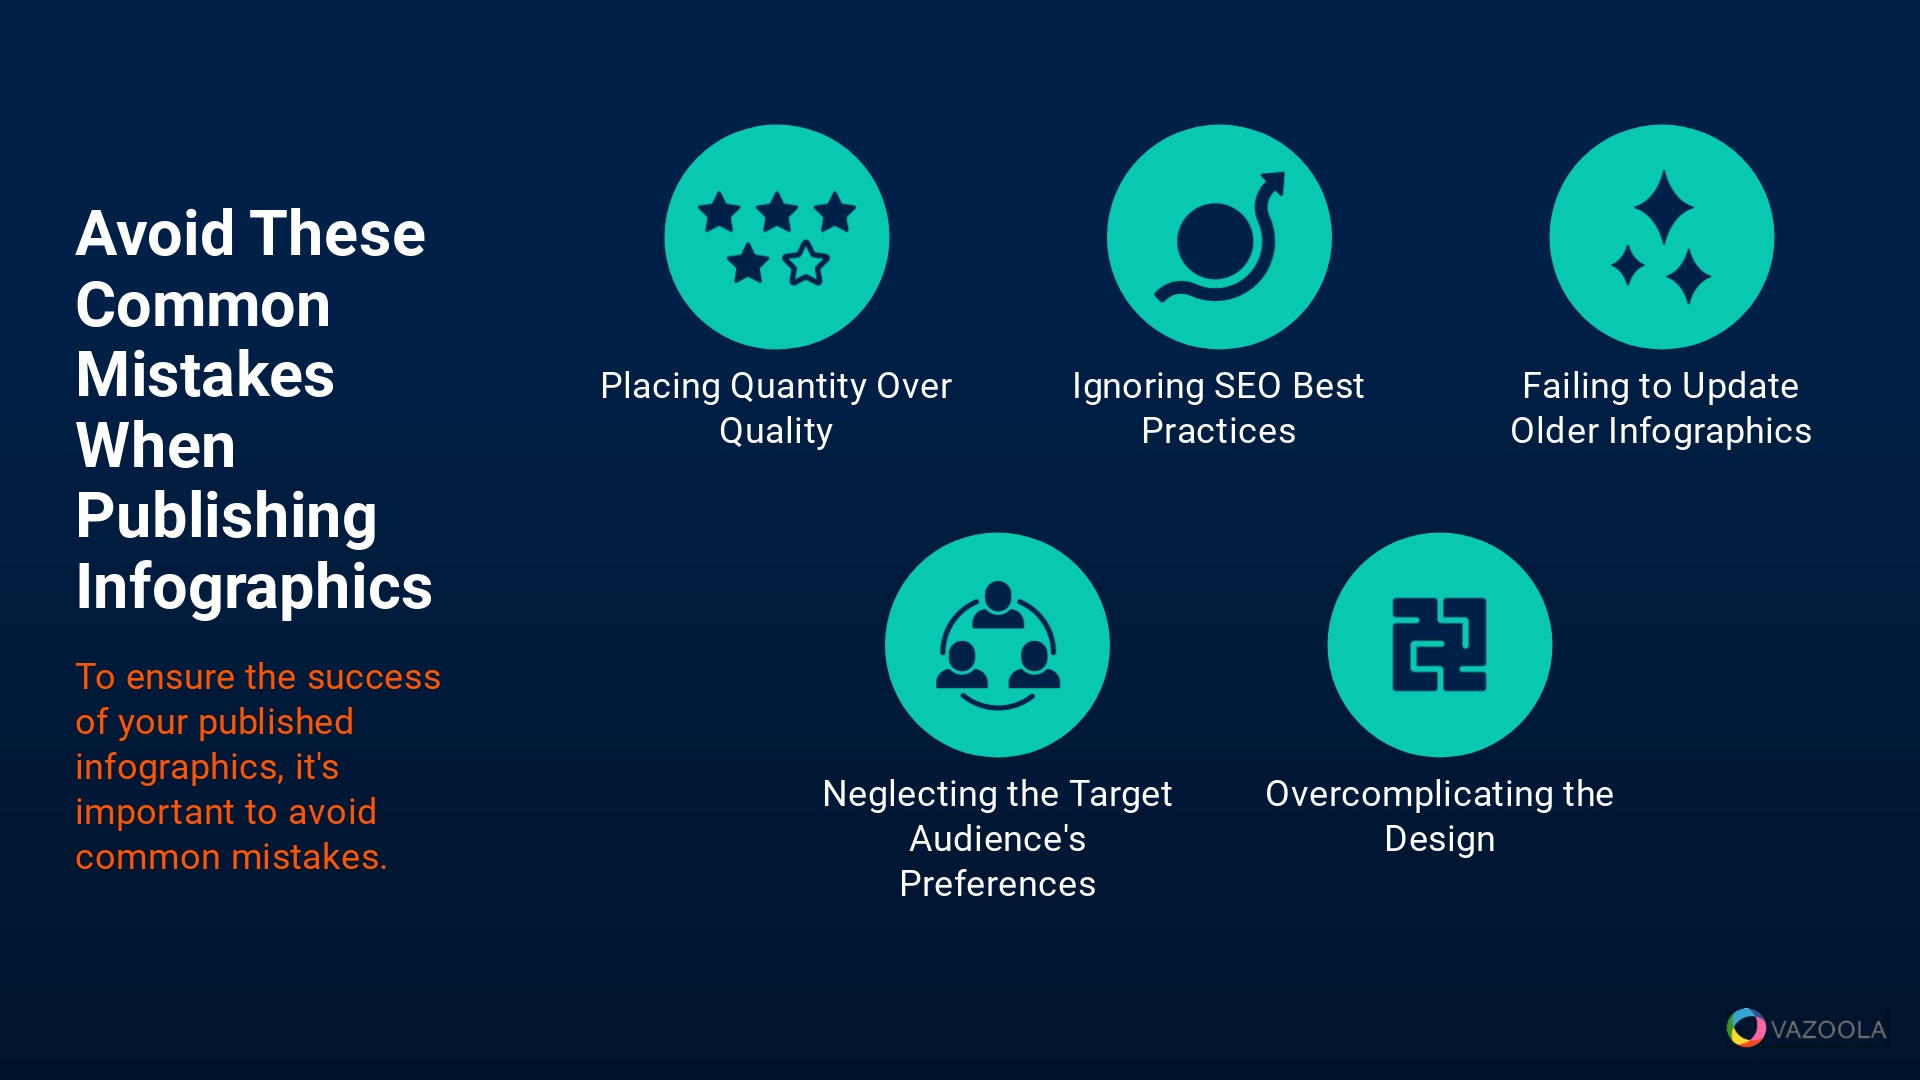
To ensure the success of your infographic campaign, it's important to avoid common mistakes. Here are a few to keep in mind:
-
Overlooking Quality for Quantity: Prioritize the quality of your infographics over quantity. A few high-quality infographics are more effective than numerous low-quality ones.
-
Ignoring SEO Best Practices: Neglecting SEO best practices in your infographic design and distribution can limit its reach. Our experience suggests incorporating SEO strategies to enhance visibility.
-
Failing to Update Old Infographics: Outdated information can harm your credibility. We recommend regularly updating your infographics to keep them relevant and accurate.
-
Neglecting the Target Audience's Preferences: Not tailoring your infographics to your audience's preferences can reduce their effectiveness. Try conducting audience research to understand their interests and needs.
Overcomplicating the Design: A cluttered or overly complex design can detract from your message. We advise keeping the design simple and focused on the key message.
Follow Up with Prospects
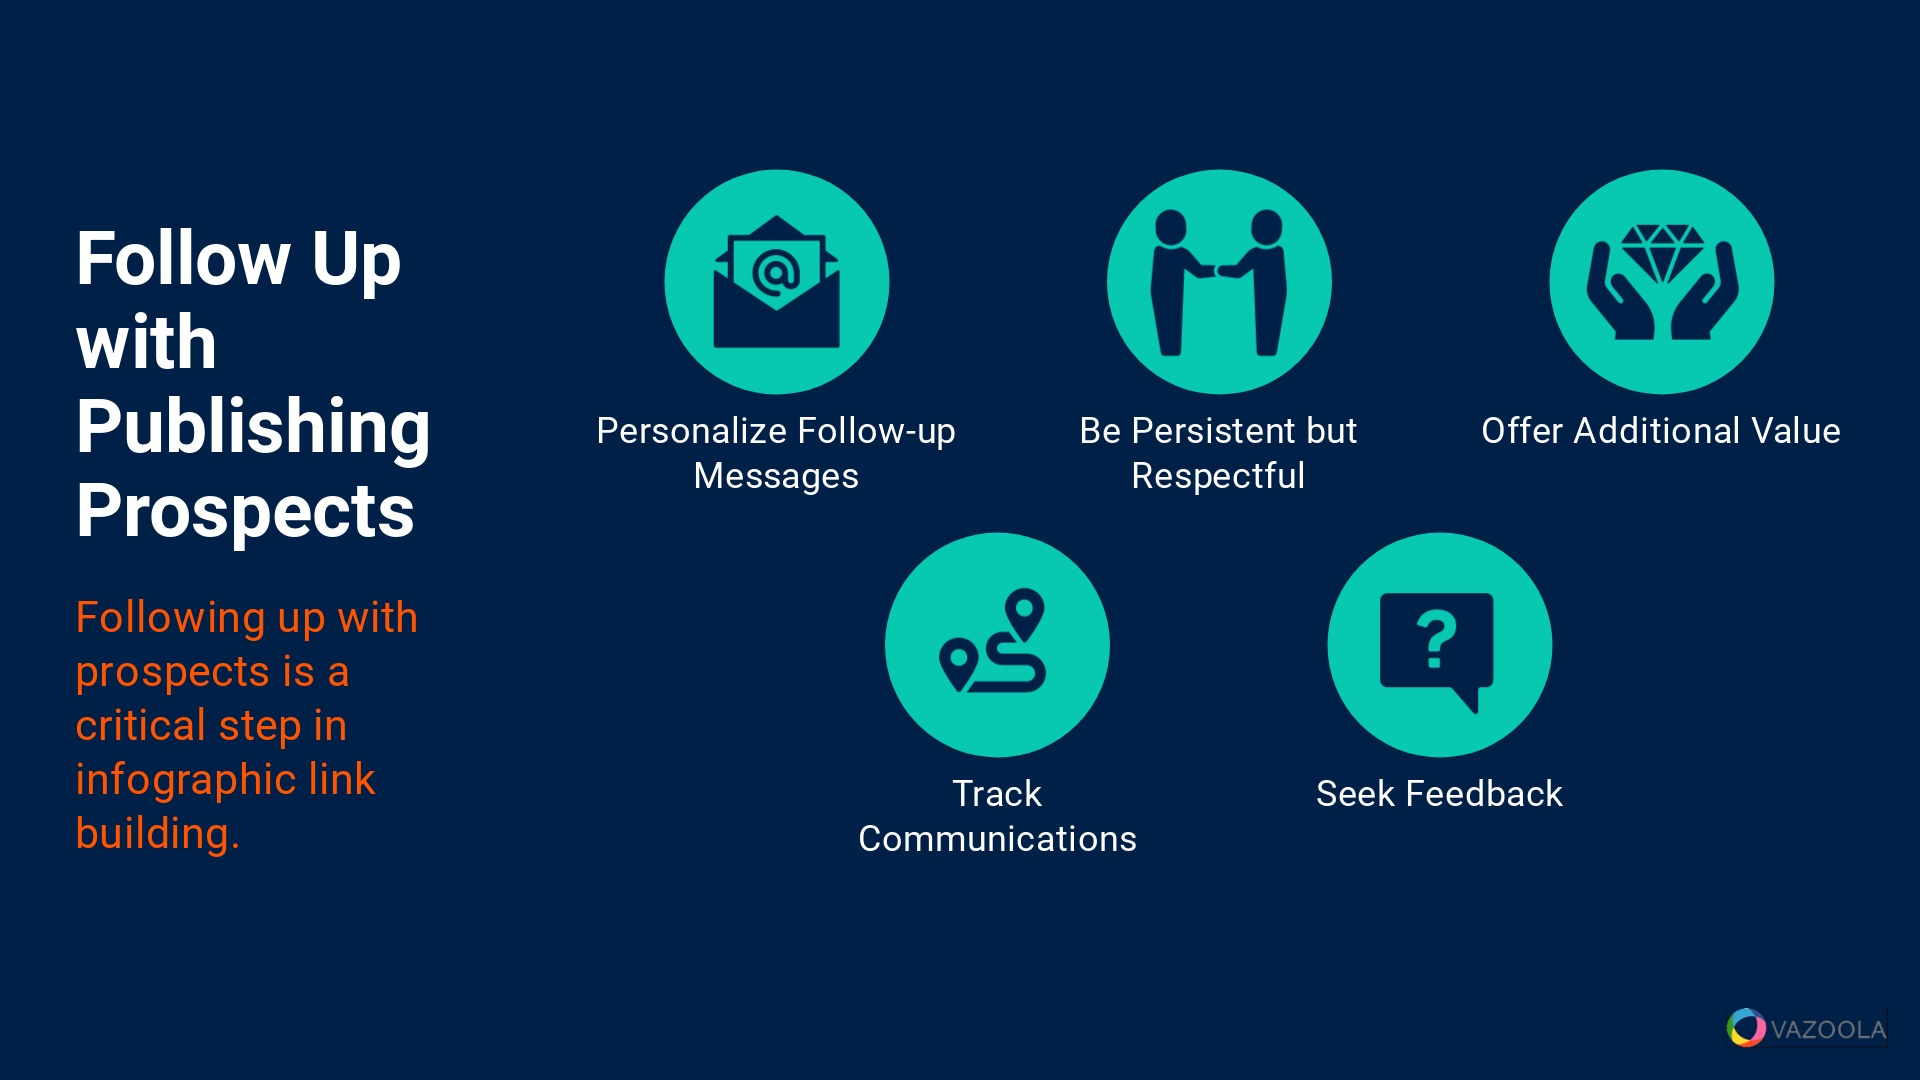
Following up with prospects is a critical step in infographic promotion. The following tips will help you keep in touch:
-
Personalize Your Follow-Up Messages: Tailor your follow-up messages to each prospect. We have seen that personalized communication is more effective than generic messages.
-
Be Persistent but Respectful: Persistence is key, but it's important to be respectful and not overly aggressive. Our experience shows that a balanced approach leads to better results.
-
Offer Additional Value: In your follow-ups, offer additional value, such as exclusive insights or additional resources. We suggest using value-added propositions to encourage positive responses.
-
Track Your Communications: Keep track of your communications to avoid repeated or misplaced follow-ups. Many successful organizations use CRM tools to manage and monitor their outreach efforts.
Seek Feedback: Ask for feedback on why your infographic may not have been used or shared. Feedback can provide valuable insights for future improvements.
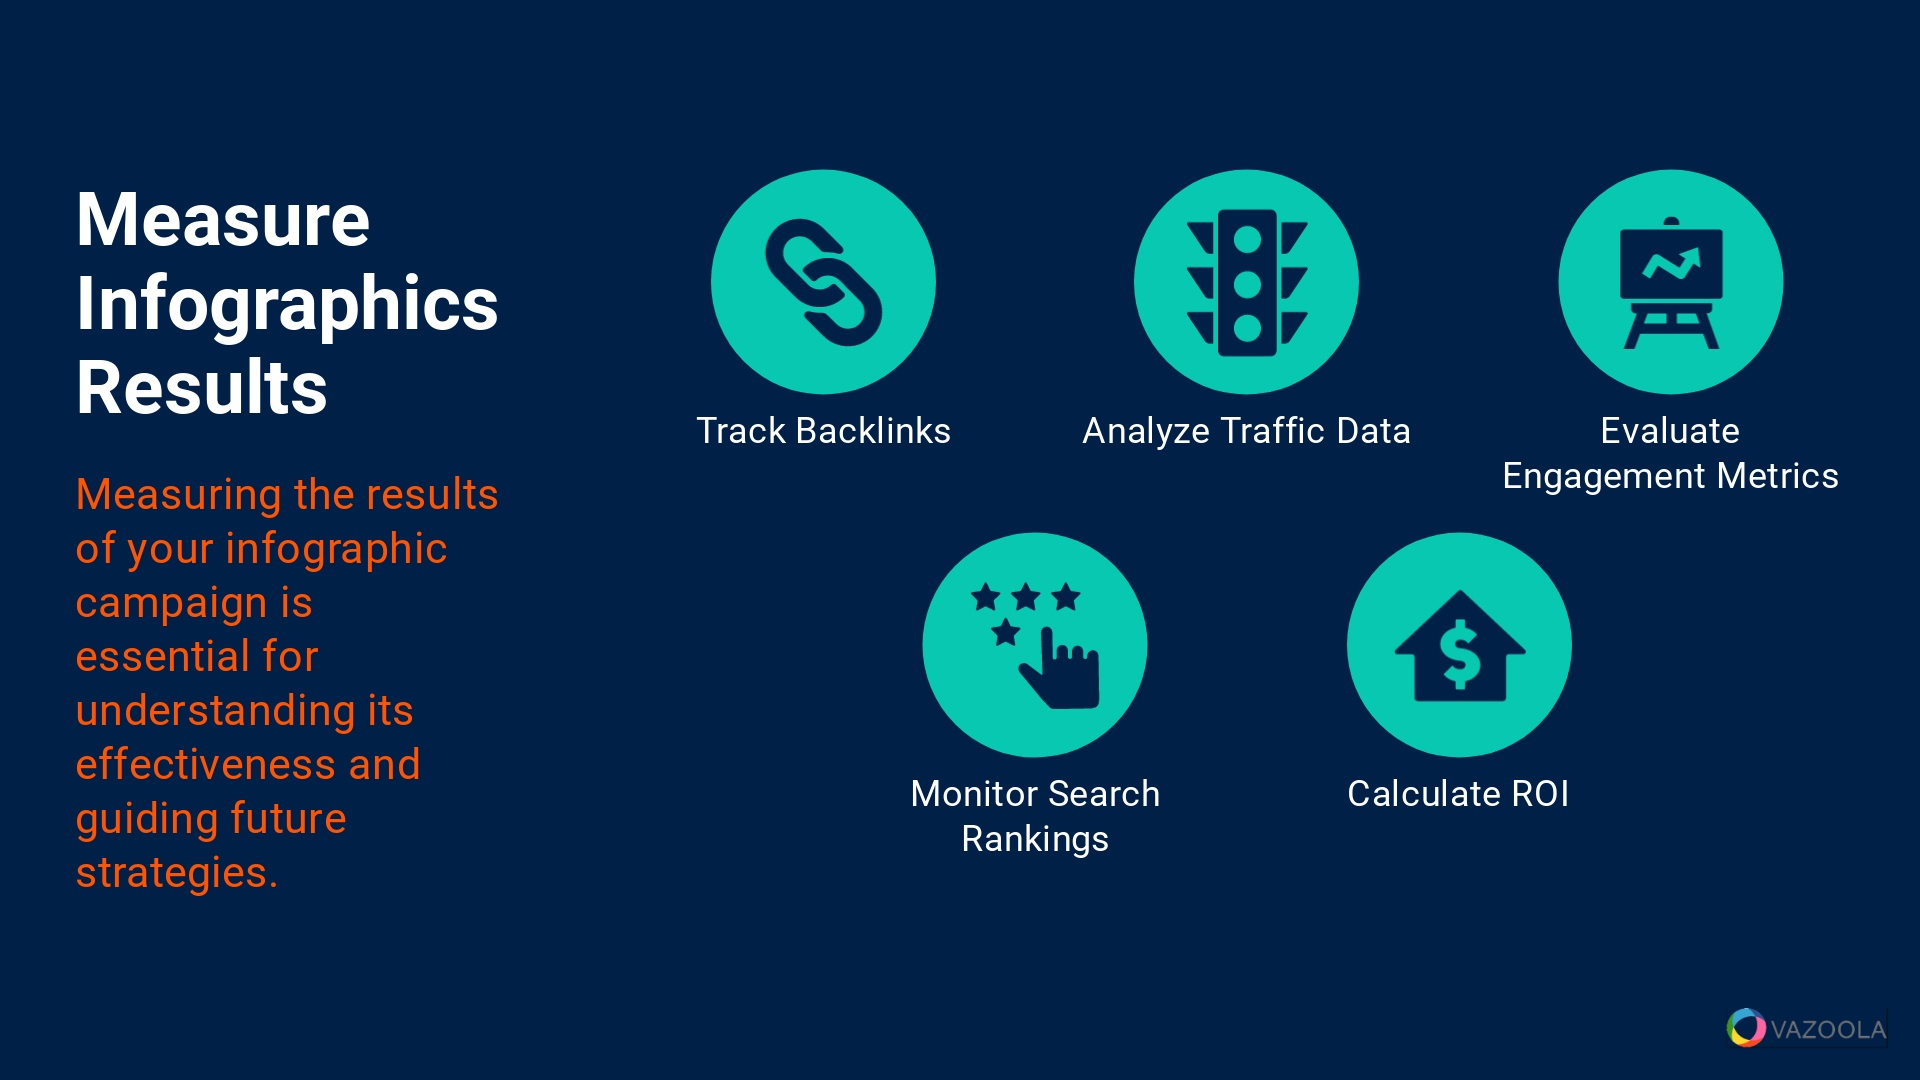
Measure Results
How do you know when you've published successful infographics?
Measuring SEO results is essential for understanding an infographic's effectiveness and guiding future strategies. When you're ready to measure your results, don't forget the following tactics:
-
Track Shares: Monitor your backlink profile for the number of shares your infographic generates. We use various SEO tools to track backlinks and assess their quality.
-
Analyze Traffic Data: Look at the traffic data to see how much your infographic is driving to your site. Our experience has shown that analyzing traffic can provide insights into the infographic's reach and impact.
-
Evaluate Engagement Metrics: Assess engagement metrics such as shares, likes, and comments. We believe that high engagement often correlates with successful SEO with infographics.
-
Monitor Search Rankings: Keep an eye on how your infographic affects your search rankings. Successful SEO pros regularly check keyword rankings to gauge the impact of their infographics.
-
Calculate ROI: Determine the return on investment by comparing the results against the resources spent. Calculating ROI helps you understand the overall effectiveness and value of the infographic link building campaign.
Pro Tips:

Track your infographic with an embed code to monitor their performance across different platforms. This data can help refine an effective link building strategy and show which platforms yield the most backlinks.